
Figure 4.
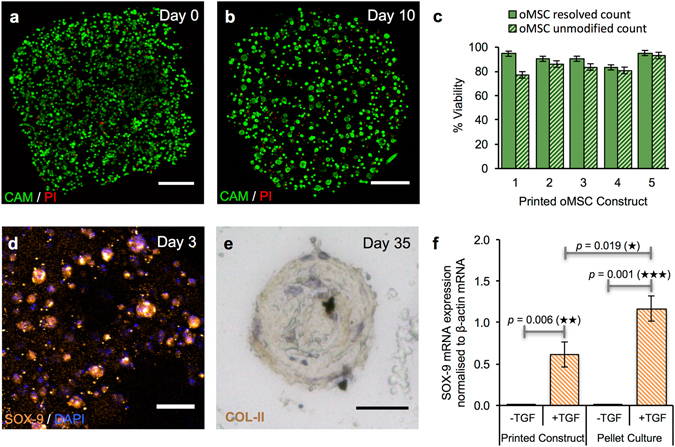
Growth and differentiation of printed oMSCs. (a,b) Image of a z-stack 3D reconstruction of live/dead-stained printed oMSCs: (a) immediately after printing and; (b) after 10 days in culture with the TGF-β3 supplement. (Scale bars = 250 μm). (c) Graph of oMSC viabilities (including standard error of the mean) for five printed constructs immediately after transfer to culture medium. Viabilities were determined by using automated object counting, values of which were used either unmodified or resolved with respect to mean cell size. (d) Confocal fluorescence micrograph of immunocytochemistry performed on a printed oMSC construct after 3 days of culture with a TGF-β3 supplement: SOX-9 (orange); nuclei (DAPI, blue); cytoplasm of live cells (CAM, calcein-AM, green). (Scale bar = 50 μm). (e) High-magnification micrograph of immunohistochemistry performed on a printed oMSC construct after 35 days of culture with TGF-β3 supplement; type II collagen (diaminobenzidine tetrahydrochloride (DAB), brown); nuclei (hematoxylin QS, blue). (Scale bar = 25 μm). (f) Digital PCR measurements of SOX-9 mRNA expression in printed oMSC constructs (n = 22) and oMSC pellet cultures (n = 24) after 7 days in chondrogenic medium with or without supplementation of TGF-β3. Each printed and pellet sample was replicated 4 to 6 times from four oMSCs sources, each extracted from a different sheep. SOX-9 expression was normalised to an endogenous β-actin control. Error bars represent standard deviations. Differences were tested by using a paired t-test, with two-tailed p values < 0.05 considered significant.