Figure 4.

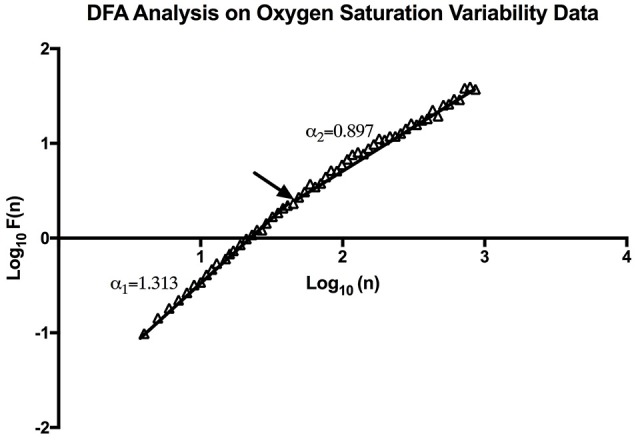
An example of DFA Analysis on SpO2 variability data showing the linear trend when plotting (n) and F (n) on a log-log scale. The arrow indicates the approximate point of the cross-over phenomenon.

An example of DFA Analysis on SpO2 variability data showing the linear trend when plotting (n) and F (n) on a log-log scale. The arrow indicates the approximate point of the cross-over phenomenon.