
Figure 4.
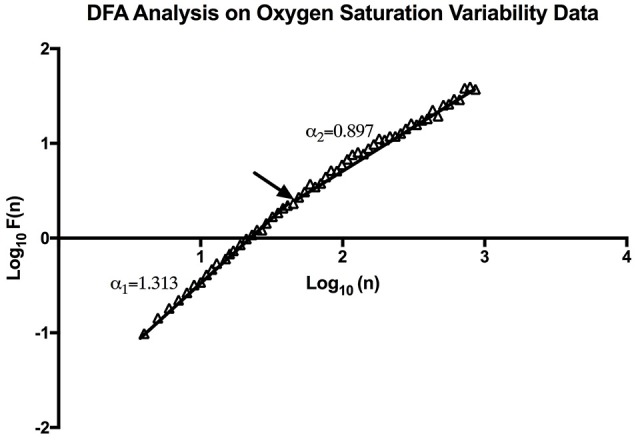
An example of DFA Analysis on SpO2 variability data showing the linear trend when plotting (n) and F (n) on a log-log scale. The arrow indicates the approximate point of the cross-over phenomenon.
Official websites use .gov
A
.gov website belongs to an official
government organization in the United States.
Secure .gov websites use HTTPS
A lock (
) or https:// means you've safely
connected to the .gov website. Share sensitive
information only on official, secure websites.
An example of DFA Analysis on SpO2 variability data showing the linear trend when plotting (n) and F (n) on a log-log scale. The arrow indicates the approximate point of the cross-over phenomenon.