
Figure 6.
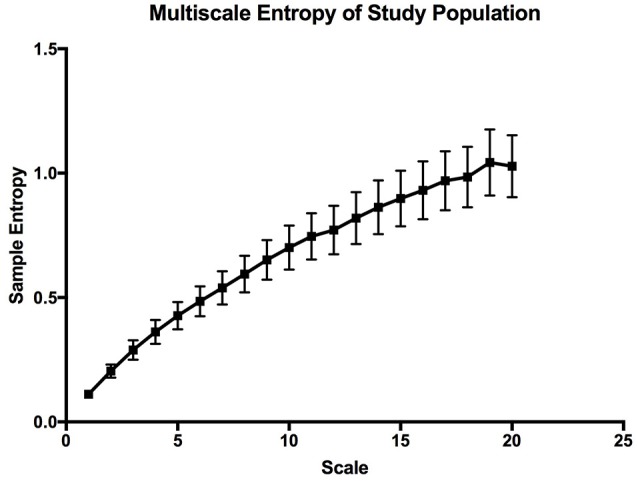
Multiscale entropy graph describing the overall complexity of the whole study population. The error bars are calculated sample error of the mean values.
Official websites use .gov
A
.gov website belongs to an official
government organization in the United States.
Secure .gov websites use HTTPS
A lock (
) or https:// means you've safely
connected to the .gov website. Share sensitive
information only on official, secure websites.
Multiscale entropy graph describing the overall complexity of the whole study population. The error bars are calculated sample error of the mean values.