
FIGURE 5.
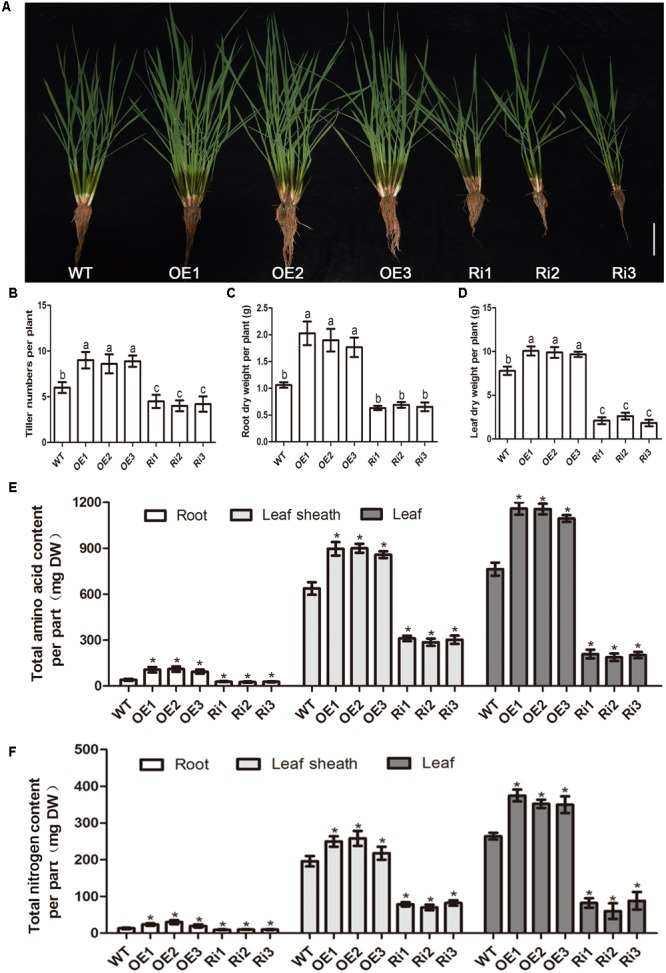
OsNPF7.3 affects biomass and nitrogen allocation from root to leaf. Phenotype (A), tiller number (B), root dry weight per plant (C), leaf dry weight per plant (D), free amino acid content per organ (E), and total nitrogen content per organ (F) were measured from 2 months sand cultured seedlings using basic nutrient solution supplemented with 1.0 mM NH4NO3 as the N source under glasshouse. The greenhouse condition is 32°C for sodium lamp 400w 14 h in the daytime and 25°C for dark 10 h in the evening. The OE1-OE3 depicts OsNPF7.3-overexpressing lines, Ri1-Ri3 depicts OsNPF7.3-RNAi lines, and WT depicts wild-type. Error bars depict the SD from three independent experiments using mixed samples from three lines. Different letters in the columns indicate a significant difference of P < 0.05 according to Duncan’s test. ∗Statistically significant differences were calculated by the Duncan’s multiple range test at the 5% level, when compared with wild-type rice (WT).