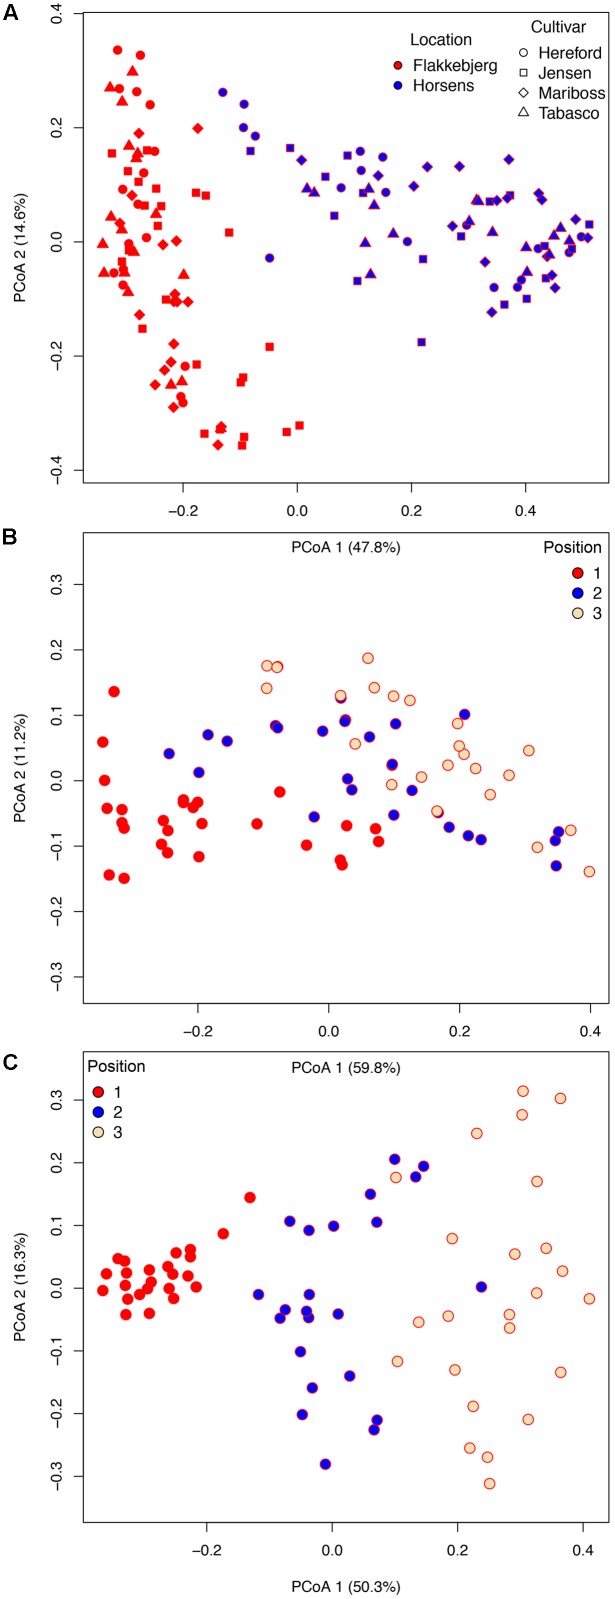
FIGURE 3.
Bray–Curtis matrices visualized using principal coordinates analysis (PCoA) (axes 1 and 2) showing the distribution of samples according to (A) cultivar and location. In (B,C), samples were split into the two locations, Flakkebjerg (B) and Horsens (C) and the distribution of samples according to leaf position is shown.

