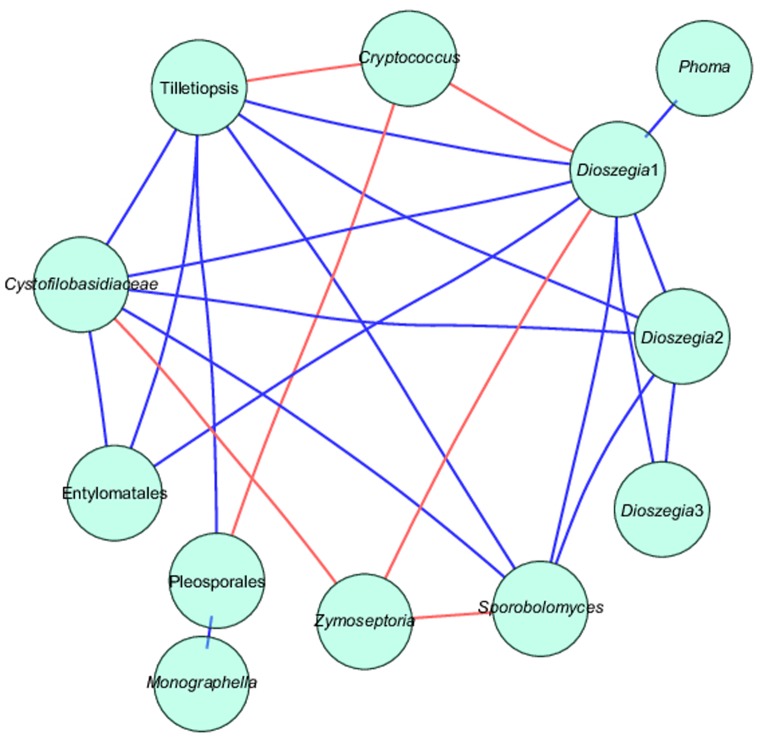
FIGURE 6.
Network analysis of taxa showing significant positive or negative co-occurrences based on Spearman’s rank correlations. Blue lines represent positive correlations and red lines represent negative correlations. See also Supplementary Table S2.

