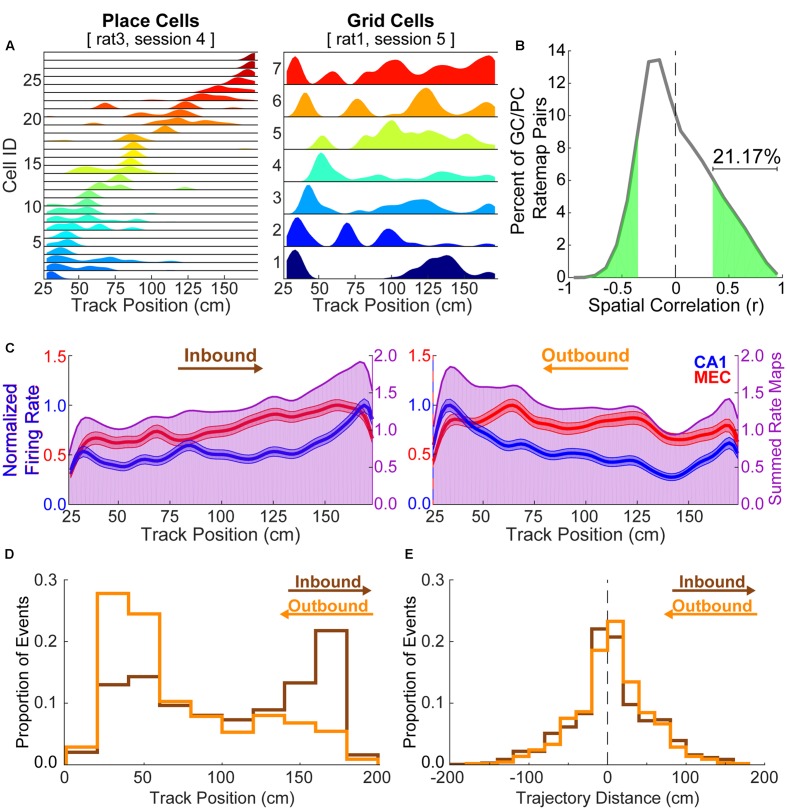
FIGURE 1.
Grid cell rate maps are often correlated with place cell rate maps by chance. (A) Example place cell (left) and grid cell (right) rate maps. Grid cells often show multiple, broad spatial receptive fields on a linear track while place cells typically exhibit a single, relatively restricted spatial receptive field. (B) 21.17% of paired grid cell and place cell rate maps from different rats are significantly positively correlated by chance. (C) Average rate maps for each track running direction and region (CA1 = blue; MEC = red, left axes) show that place cells disproportionately represent the track ends relative to other locations. The summed average rate map (purple, right axes) facilitates visualization of spatial overlap in each region’s average rate map. (D) Histograms show the distribution of start locations for each CA1 replay trajectory by replay direction (inbound = brown; outbound = orange). Trajectory start locations beyond the range of track positions considered when formulating rate maps (i.e., within 25 cm of the ends of the 198 cm track) were observed when the y intercept for the line of best fit was outside of the spatial range of the posterior probability matrix (i.e., 25–173 cm). Note that replayed trajectories, as defined following the procedure described in section “Materials and Methods,” tend to begin at ends of the track opposite of what one might expect given the calculated replay direction. (E) Replayed trajectories often traversed only a small portion of the linear track (inbound = 4.49 ± 1.99 cm; outbound = 5.28 ± 1.84 cm).

