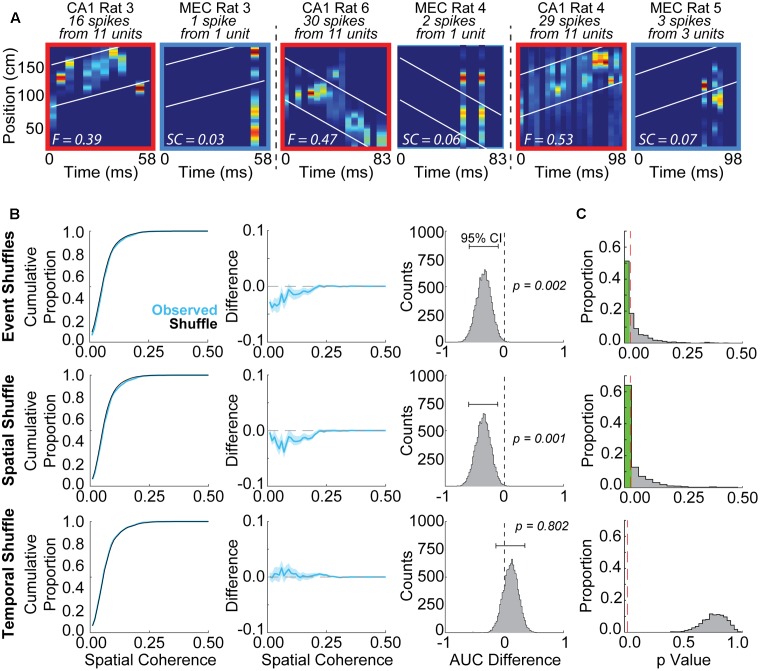
FIGURE 2.
Grid cells and place cells recorded from different rats exhibit spuriously significant spatial coherence using some shuffling methods but not others. (A) Examples of posterior probability matrices for randomly paired place cell replay events and grid cell firing epochs. Rat numbers, as well as cell and spike counts, are indicated at top of each panel. White lines indicate ±30 cm from the line of best fit applied to the CA1 posterior probability matrix. Fit (F) or spatial coherence (SC) scores are indicated by the white text within each panel. (B) Example results from a single iteration using the Spatial Coherence method to evaluate coordinated replay between grid and place cells. A lower area under the curve was observed for the bootstrapped ‘Observed’ data distribution (blue, mean ± SD) relative to the shuffle distribution (black) for Event Shuffles (top row) and Spatial Shuffles (middle row), but not Temporal Shuffles (bottom row). This observation indicates spuriously greater spatial coherence scores for the randomly paired data relative to the event and spatial shuffled data, but not the temporal shuffled data. The difference between the two curves (Observed – Shuffle) is plotted in the middle column. The right column displays the distribution of differences between the area under the curve for the shuffle and each bootstrap of the Observed data (brackets indicate 95% confidence intervals for this example iteration). (C) Results are shown from 1,000 iterations of the Spatial Coherence statistical evaluation procedure using randomly paired grid cell and place cell firing epochs. 56.9% of iterations were spuriously detected as statistically significant when compared to Event Shuffle distributions (top row). 60.5% of iterations were spuriously detected as significant when compared to Spatial Shuffle distributions (middle row). No iterations were found to be significant when compared to Temporal Shuffle distributions (bottom row). Red dashed lines indicate an alpha level of 0.025.

