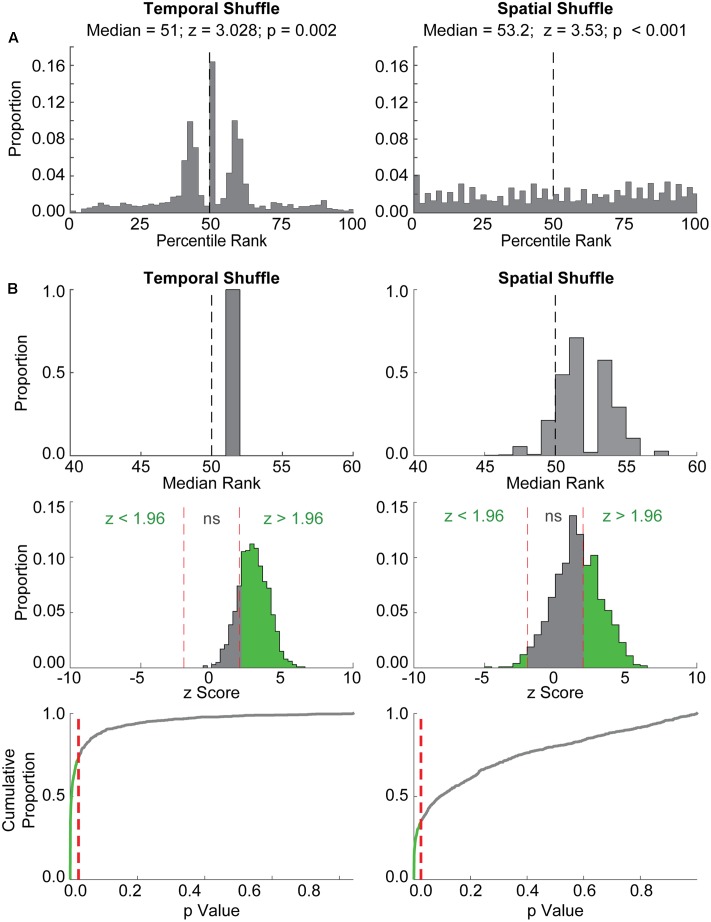
FIGURE 3.
The event map method also detects spuriously significant coordination between place cell replay events and random epochs of grid cell firing from different rats. (A) Example results from a single iteration of the ‘event map’ evaluation procedure are shown. Histograms depict the distribution of ranks for each Observed correlation between randomly paired grid and place cell firing epochs relative to the distribution of either temporally shuffled (left) or spatially shuffled (right) data. The median of each distribution, along with the z-statistic and p-value resulting from the Wilcoxon Signed Rank test for these examples, are shown at top. The vertical dashed line at 50% represents the median rank that would be expected by chance. Although the distribution of Temporal Shuffle ranks was centered around ∼50% and the Spatial Shuffle distribution was relatively uniform, both comparisons with Observed correlations were significant using the Wilcoxon Signed Rank Test. (B) Results from 1,000 iterations of the event map procedure are shown. Histograms in the top row depict the distributions of median ranks from each of the 1,000 iterations relative to Temporal Shuffle and Spatial Shuffle distributions. Note that many of the median ranks are greater than 50, indicating that correlations between randomly paired grid cell and place cell firing epochs would often be characterized as significant. The middle row shows the distribution of z-scores, corresponding to Wilcoxon’s signed rank test-statistic (W), with the proportion of significant results indicated in green. P-values for each iteration are depicted in the bottom row as cumulative distributions. Red dashed lines indicate an alpha level of 0.025. The green portion of the line corresponds to the proportion of spuriously significant results observed.

