
Figure 4.
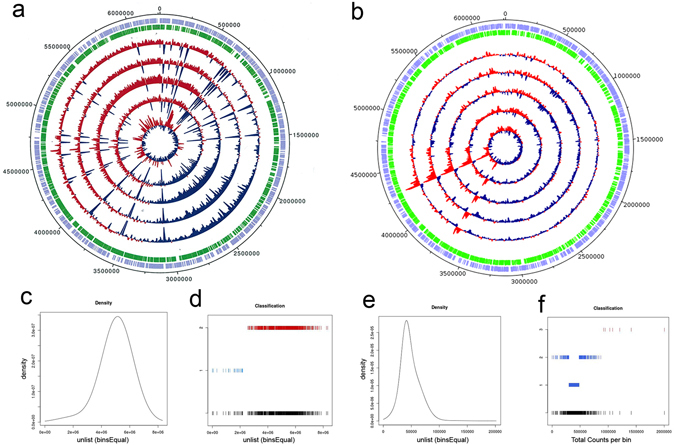
Analysis of total and internal OMV-derived DNA sequences from five separate biological replicates of P. aeruginosa OMVs. Circular plots for the total (a) and internal (b) DNA read count across each of the replicates show read count at each base pair position. Positions showing greater than average read density are coloured red while those with less than average density are coloured blue. A peak in read count density is visible in the internal DNA at approximately 4,290,000 bp. The outer circles show the location of the genes on the positive (purple) and negative (green) strands of the reference genome. The total read counts from 603 equally-sized and contiguous bins spanning the genome were computed and plotted as density distributions for the total (c) and internal (d) DNA. A Kolmogorov-Smirnov test revealed that the read count distribution for the total DNA did not differ from a normal distribution, whereas the internal DNA possessed a long tail at the upper end of the distribution which created a significant deviation from the normal distribution (p = 1.382 × 10⁻⁶). The Gaussian finite mixture models confirmed these observations (d,f). The counts from the majority of the total DNA bins were contained within a dominant Gaussian distribution (red), while a secondary Gaussian distribution represented a small subset of bins with relatively low read densities (blue) (d). In contrast, the counts for the internal DNA bins were represented by three Gaussian distributions: two overlapping distributions (blue) represented the majority of bins with counts ranging from 0 to approximately 800 000; and a third Gaussian distribution (red) represented bins with counts at higher values (f).