
Figure 4.
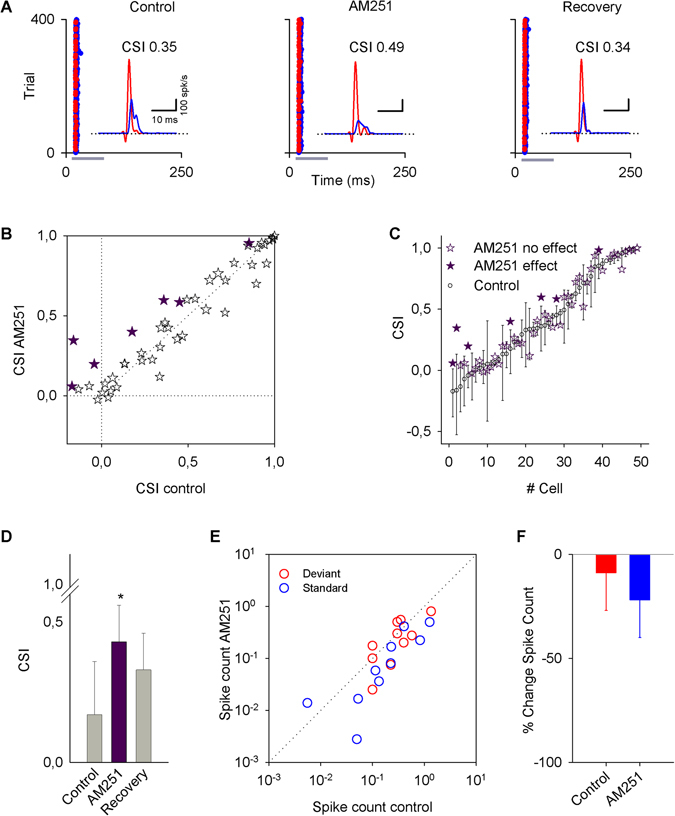
Effects of AM251 on the activity of IC neurons. (A) Typical recordings of an IC neuron under an oddball stimulation paradigm before (control), during (AM251), and after (recovery) an i.v. application of AM251. (For this neuron, the standard frequency was 8574 Hz, and the deviant frequency was 10472 Hz.) The insets show the PSTH of the responses. (B) Scatter plot of the CSI in control condition versus AM251 application. (C) Bootstrapping analysis showing that AM251 produced significant changes in the CSI only in 7/49 neurons. (D) Bars represent the average of the CSI values ± SE in control condition, AM251 application and recovery. (E) Scatter plot of the firing rate showing the spike count for deviant and standard frequencies in control condition versus AM251 application. (F) Bars show the percent change in the spike count averaged for deviant and standard stimuli by AM251 application. There is a tendency for a decrease in the firing rate for both frequencies. Vertical bars represent the % change ± SE.