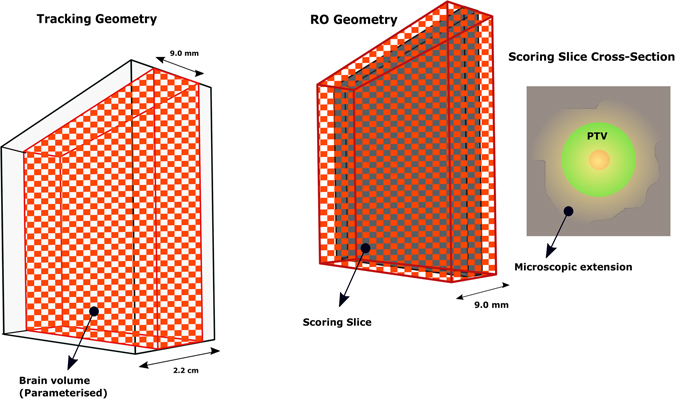
Figure 8.

The real tracking geometry is shown on the left. A 9 cm × 9 cm × 2.2 cm box enclosed the brain volume (9 cm × 9 cm × 9 mm) which was divided into 3 × 3 × 3 mm 3 and the material parametrisation was implemented for all voxels within. In the middle, the RO geometry is shown which consisted of the brain volume enclosing the scoring plane located in the middle of the volume and divided into 20 × 20 × 20 μm 3 (the size of glioma cells). The RO geometry communicates in sync with tracking geometry to score the dose in the cells defined in the scoring plane. On the right, the cross section of the scoring plane is shown. It should be noted that this diagram is not to scale to allow illustration of details.
