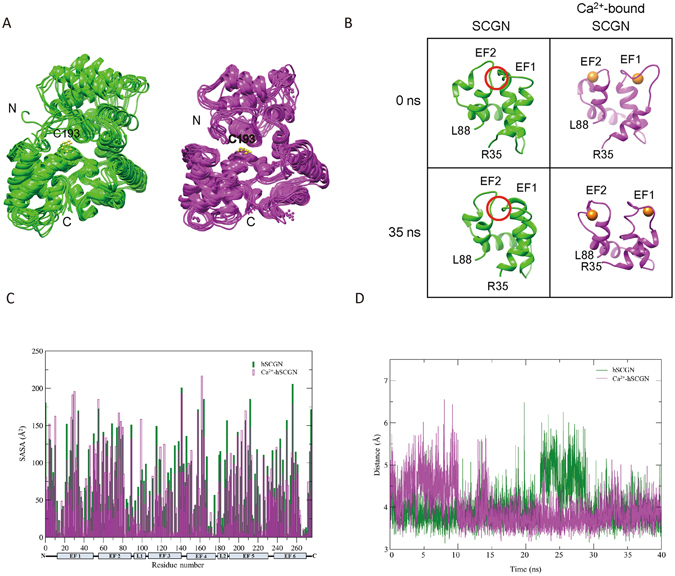
Figure 3.

Dynamics of apo and six Ca2+-bound hSCGN in molecular dynamics simulation. (A) The coordinates of apo-hSCGN and Ca2+-bound hSCGN saved every 5 ns during MD simulations are superimposed, respectively. (B) Snapshots of the domain I of apo-hSCGN and Ca2+-bound hSCGN at 0 ns and 35 ns. Ca2+ ions are drawn as orange spheres. The conformation of the red circled area is a β-sheet at 0 ns when analyzed by STRIDE (http://webclu.bio.wzw.tum.de/cgi-bin/stride/stridecgi.py). (C) The average SASA values for every residue of 400 structures saved every 100 ps during 40 ns simulation. (D) The distances between Cys253 and Cys269 during simulation for apo-hSCGN (green) and Ca2+-bound hSCGN (magenta).
