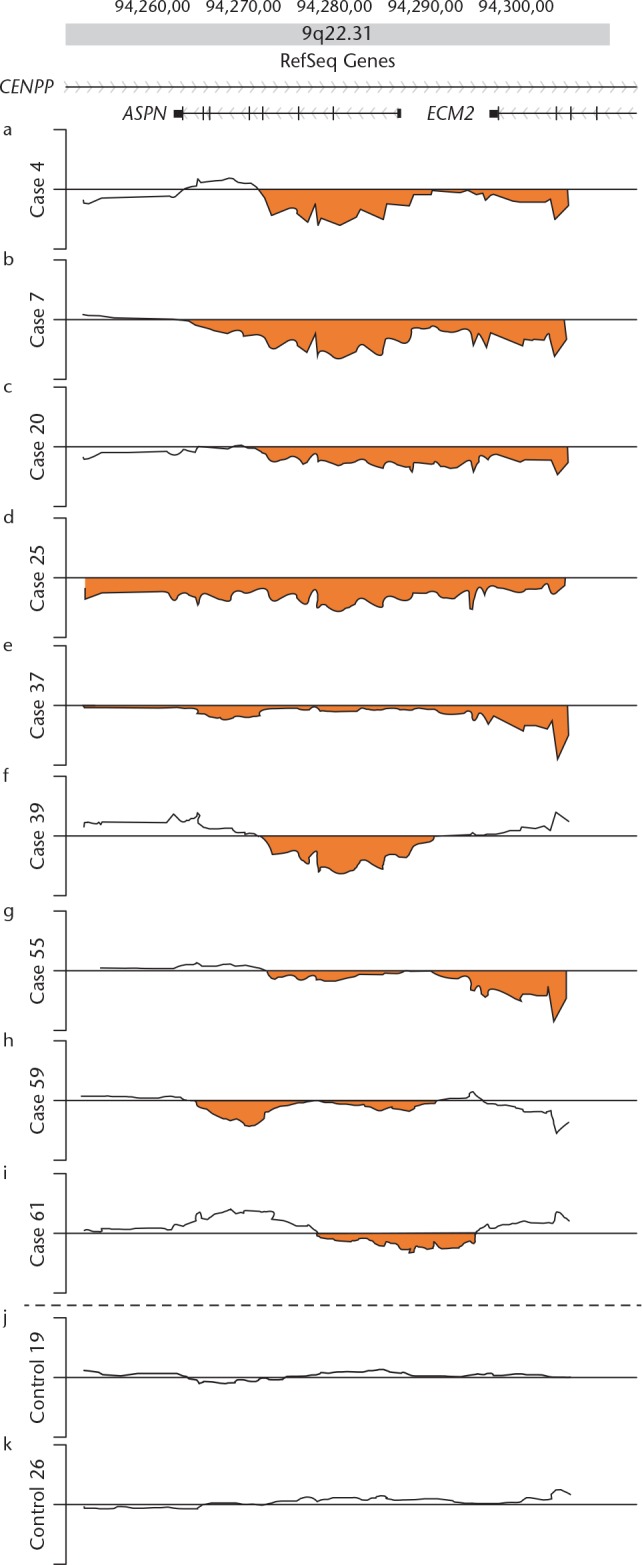
Fig. 2.

Fine structures of the loss of copy number in the 60 kb 9q22.31 region harbouring the ASPN gene resolved by Agilent high-density tiling microarray. Log2 ratio (y-axis) was plotted using the moving mean along the genome position (x-axis). Plots for the nine affected acetabular dysplasia patients (cases 4, 7, 20, 25, 37, 39, 55, 59, and 61) are shown in parallel with plots of two control subjects (controls 19 and 26). The dark line represents a copy number plot along the genome for each subject between genomic positions 94 250 000 (left) and 94 310 000 (right). The orange areas indicate ‘‘loss of copy number’’. The top map shows the positions of putative genes in the region.35 CENPP, centromere protein p; ASPN, asporin; ECM2, extracellular matrix protein 2.
