Figure 2.

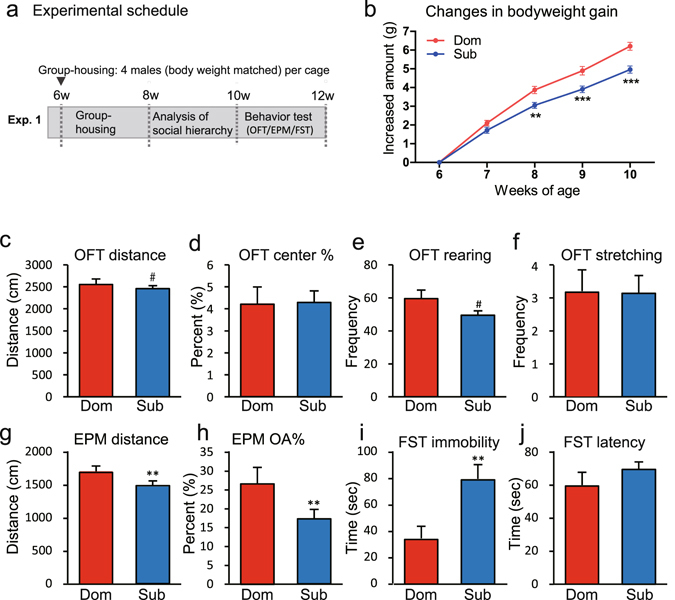
Effects of social hierarchy on growth and behaviour. (a) Experimental schedule. The social hierarchy was determined by analysing dyadic agonistic interactions between each combination of two males in the home cage for 2 weeks (when the mice were aged 8–10 weeks). In Experiment 1, all of the animals were used in behavioural tests at age 10–12 weeks (n = 16 cages). (b) Comparison of body weight gains in different hierarchies in group-housed mice (*P < 0.05, **P < 0.01, dominant versus subordinate). The behaviours of the dominant (Dom) and subordinate (Sub) males were compared. (c–f) Open-field test (OFT) results for (c) the distance travelled, (d) the percentage of time spent in the central area, (e) the rearing frequency, and (f) the stretching frequency. (g and h) Results of the elevated plus-maze (EPM) test, showing (g) the distance travelled and (h) the percentage of time spent in the open arms. (i and j) Results of the forced swim test (FST), showing (i) the immobility time and (j) latency to immobility (# P < 0.1, **P < 0.01).
