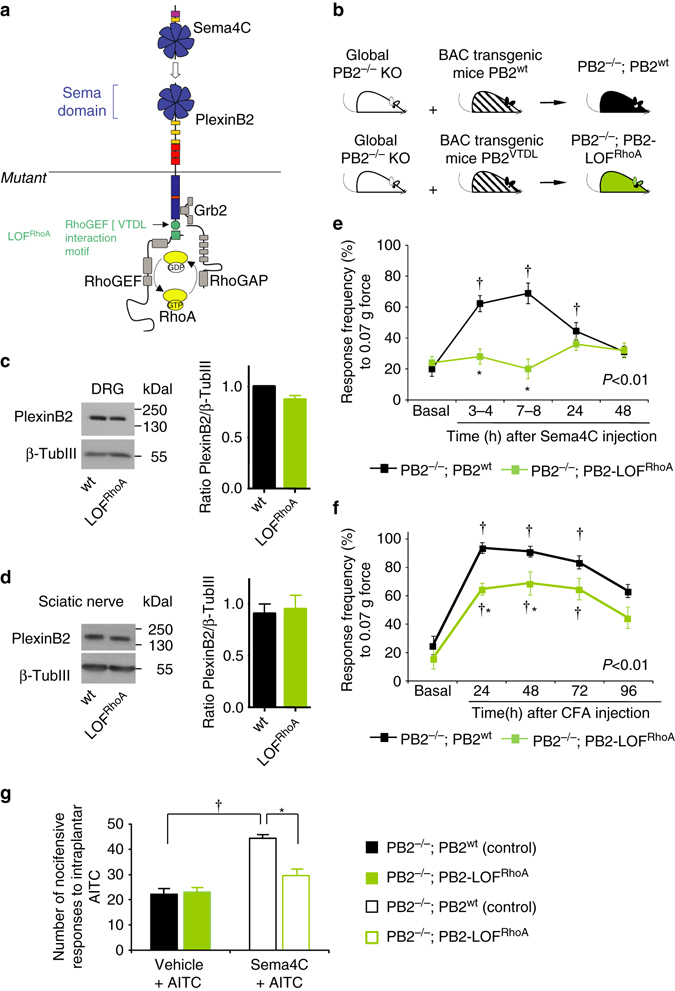
Fig. 8.

RhoA-ROCK signaling downstream of Plexin-B2 activation mediates Sema4C-induced mechanical hypersensitivity and contributes to inflammatory hypersensitivity in vivo. a, b Schematic representation of the allelic series of transgenic Plexin-B2 mice carrying specific mutations in the intracellular domain resulting in loss-of-function (LOF) of the RhoA activation pathway. c, d Examples (left) and densitometric quantifications (right) of western blot analysis of PlexinB2 signal in lysates of L3-L4 DRGs (c, n = 4 mice/group) or Sciatic nerve tissue (d, n = 3 mice/group) of transgenic Plexin-B2 mice carrying specific mutations in the intracellular domain resulting in LOF of the RhoA activation pathway (PB2−/−; PB2-LOFRhoA) and the control mice carrying wild-type (wt) Plexin-B2 (PB2−/−; PB2wt). Data are represented as fold changes of the ratio of PlexinB2 over loading control signal β-TubulinIII, p > 0.05. e Analysis of Sema4C-induced mechanical hypersensitivity to plantar application of 0.07 g von Frey force in PB2−/−; PB2-LOFRhoA and control mice. f Analysis of inflammatory hypersensitivity, represented as response frequency to 0.07 g force before and at 24, 48, 72 and 96 h following hindpaw CFA injection. N = 5 mice/group for PB2−/−; PB2-LOFRhoA mice and n = 8 for control mice in all experiments e and f. g Nocifensive responses to intraplantar application of AITC following intraplantar injection of vehicle or Sema4C in PB2−/−; PB2-LOFRhoA and control PB2−/−; PB2wt mice (n = 8 mice/group). Student t-test was performed in c and d, ANOVA for repeated e, f or random g measures followed by Tukey’s test was performed. In e and f, P values upon comparing entire curves with each other are represented. In all panels, P < 0.05 indicated by * as compared to the corresponding control groups and by † as compared to basal. Error bars represent s.e.m
