
Figure 2.
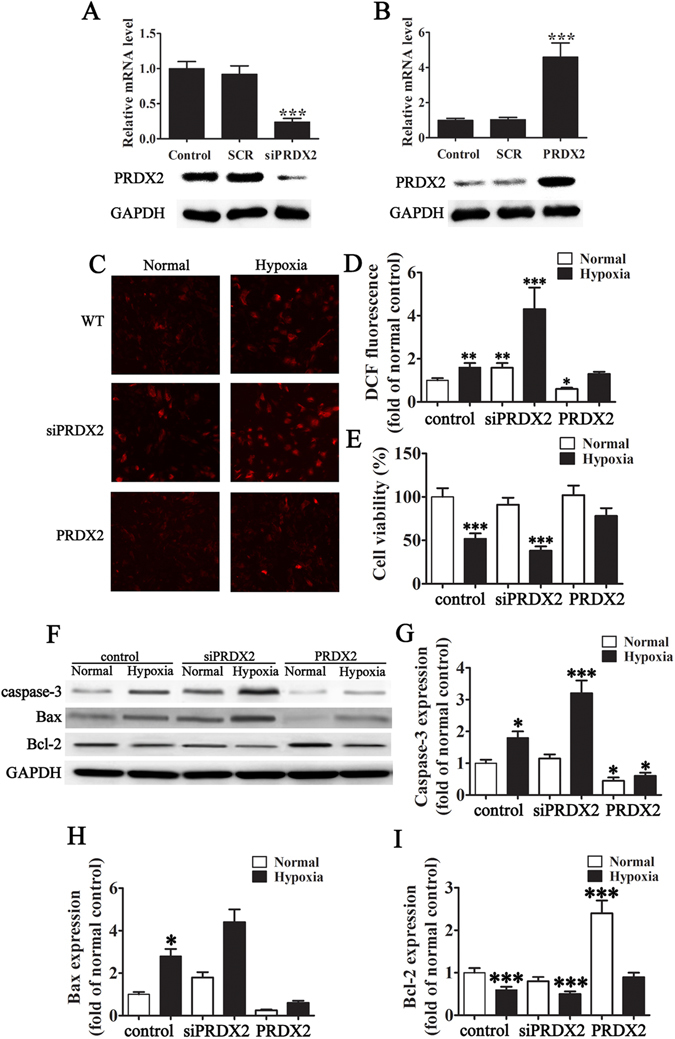
The expression of PRDX2 inhibit hypoxia-mediated oxidative stress injury to H9c2. (A) H9c2 cells were transfected with PRDX2 siRNA (siPRDX2) and control siRNA (siSCR) at a concentration of 80 pmols. Cells were harvested 36 h after the transfection, and the silencing effect on PRDX2 mRNA levels was determined by RT-PCR. The silencing effect of PRDX2 siRNA at the protein level was determined 48 h post-transfection using western blotting. The data are presented as means ± SD of the mean from five separate cell experiments. ***p < 0.001 vs control. (B) H9c2 cells were transfected with a PRDX2 overexpression vector and control (SCR). Cells were harvested 48 h after the transfection, and the PRDX2 mRNA levels were determined by RT-PCR. The overexpression effect of PRDX2 at the protein level was determined 48-h post-transfection using western blotting. GAPDH was used as a loading control. The data are presented as means ± SD of the mean from five separate cell experiments. ***p < 0.001 vs control. (C and D) Mitochondrial ROS production in H9c2 cells after culture in normal hypoxic conditions for 6 h with/without PRDX2 overexpression or down-regulation. The data are presented as means ± SD of the mean from ten independent views. ***p < 0.001 vs control. Magnification 200×. (E) The effects of PRDX2 on hypoxia-induced H9c2 cell viability were detected after exposed to hypoxia medium for 6 h. The data are presented as means ± SD of the mean from three separate cell experiments. *p < 0.05, **p < 0.01, ***p < 0.001 vs control. (F) Western blot analysis of Bcl-2, Bax, Caspase-3. GAPDH was used as a loading control. (G–I) Statistical analysis of band intensity for Bcl-2, Bax, and Caspase-3. The data are presented as means ± SD of the mean from three separate cell experiments. *p < 0.05, **p < 0.01, ***p < 0.001 vs control.