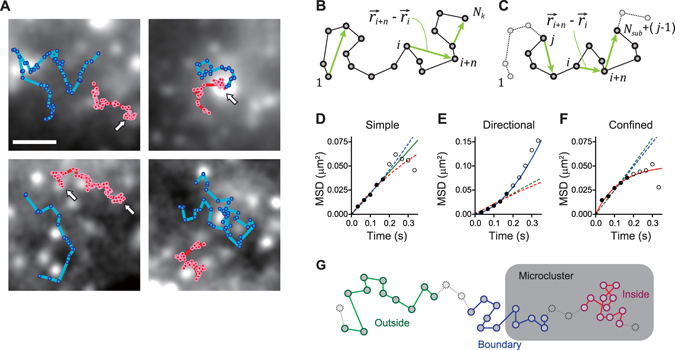
Figure 3.

Schematic representation of moving subtrajectory analysis and kinetics analysis. (A) Shown is a gallery of single-molecule trajectories of Qdot 585-labeled CD45 (cyan) and Qdot 655-labeled CD3ε (red) superimposed upon 200-frame averaged CD3ζ-EGFP images, which were obtained by analysis of simultaneous triple-color single-molecule movies recorded at 33.33 ms/frame. Arrows indicate trajectories inside TCR microclusters. Bar, 1 μm. (B) Standard MSD analysis using single-molecule tracking. (C) Moving subtrajectory MSD analysis. All subtrajectories were composed of successive N sub spots (N sub = 11 in the present study), i.e., (N sub − 1) steps were extracted from each trajectory, and their MSD curves were calculated. (D–F) Representative examples of sorting of the subtrajectories into the three diffusion types: simple (D), directional (E), and confined (F). After each subtrajectory was fitted to all three equations for the simple (Equation 5, green), directional (Equation 6, blue), and confined (Equation 7, red) diffusion, it was assigned to the diffusion type giving the least residual standard error of the fitting (solid line: assigned, dashed line: not assigned). Within 10 data points of the MSD of a single subtrajectory, the first 5 points (filled circle) were used for the fitting and the later points (open circle) were not. (G) Schematic representation of sorting of the subtrajectories of a trajectory into the three location groups: the inside (red), boundary (blue), and outside (green) of the microcluster.
