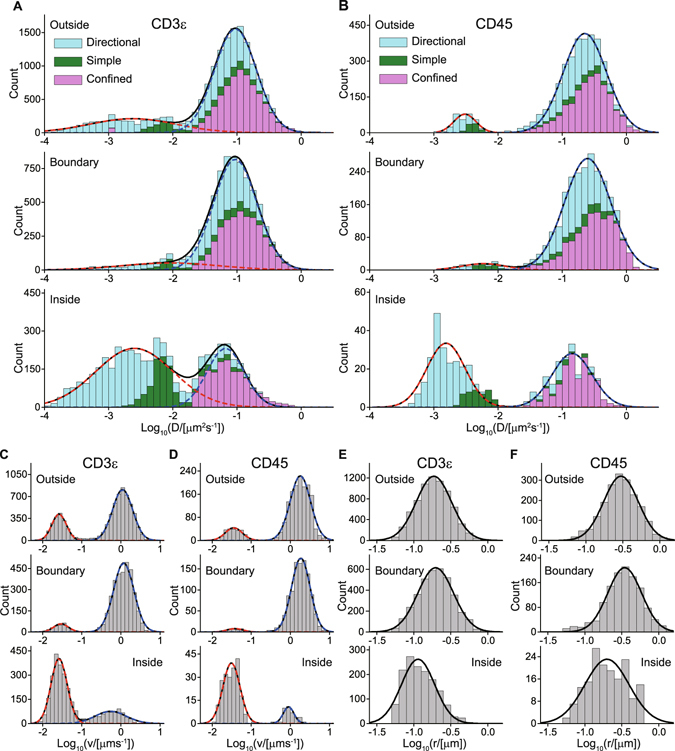
Figure 5.

Two mobility states and their properties for CD3ε and CD45 revealed by moving subtrajectory analysis. (A,B) Distributions of log10(D/[μm2/s]) on the inside, at the boundary, and on the outside of the microclusters obtained by moving subtrajectory analysis. The three diffusion types are shown as follows: simple (green), directional (cyan), and confined (magenta). The histograms of overall distributions, which were the total of the three diffusion types, were fitted by the dual normal distribution corresponding to the two-state diffusion model (Equation 9, black line) composed of the slower (red dashed line) and faster (blue dashed line) mobility states. The distributions separated into the three diffusion types were also well fitted by the dual normal distribution (Table S4)), (C,D) Distributions of log10(v direc /[μm/s]), where v direc is the velocity of the directional movement of the directional diffusion mode (Equation 6). The histograms were fitted by the dual normal distribution (black line), composed of the slower (red dashed line) and faster (blue dashed line) components. (E,F) Distributions of log10(r conf /[μm]), where r conf is the confinement radius of the confined diffusion mode (Equations 7 and 8). The histograms were fitted by the normal distribution (black line).
