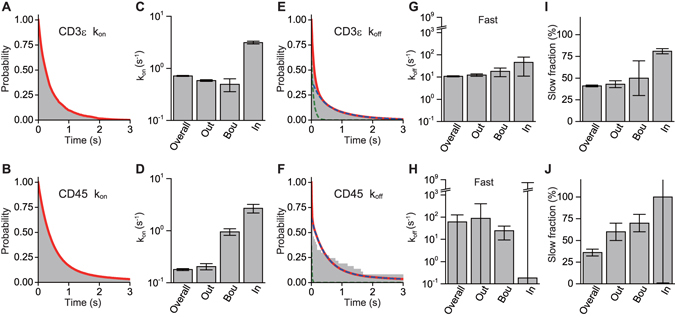
Figure 6.

Heterogeneity in the interaction of CD3ε and CD45 with the microclusters is found in dissociation but not in association, as revealed by kinetics analysis. (A,B) Cumulative distributions of the overall durations T fast of the dissociated state (faster mobility state) of CD3ε (A) and CD45 (B). Overall data were obtained and analyzed without location classification. The distributions were well fitted by a single-exponential function in terms of the transition (Equation 12, red line), which gave overall association rates k on. (C,D) Association rates of CD3ε (C) and CD45 (D). Location-classified association rates k on_in, k on_bou, and k on_out on the inside, at the boundary, and on the outside of the microclusters, respectively, were obtained in the same manner using Equation 13. (E,F) Cumulative distributions of the overall durations T slow of the associated state (slower mobility state) of CD3ε (E) and CD45 (F). In contrast to the association rate analysis, the distributions were fitted by a double-exponential function in terms of the transition (Equation 14, red line), which gave slower overall dissociation rates k off_slow (blue dashed line) and faster overall dissociation rates k off_fast (green dashed line). (G,H) Faster dissociation rates of CD3ε (G) and CD45 (H). Location-classified faster dissociation rates k off_in_fast, k off_bou_fast, and k off_out_fast on the inside, at the boundary, and on the outside of the microclusters, respectively, were obtained in the same manner using Equation 15. (I,J) Fraction ν of the slower dissociation of CD3ε (I) and CD45 (J) (Equations 14 and 15). The relative occurrences of the slower and faster dissociations are ν and 1 − ν, respectively.
