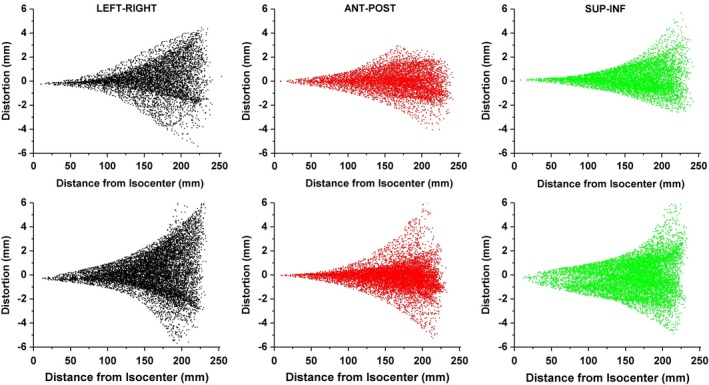
Figure 4.

(Top Row) Distortion plotted as a function of radial distance from isocenter as generated with previously validated MATLAB software for the left‐right (LR), anterior‐posterior (AP), and superior‐inferior (SI) distortion from left to right, respectively. (Bottom Row) Similar distortion maps as measured with the new phantom and generated with 3D Slicer.
