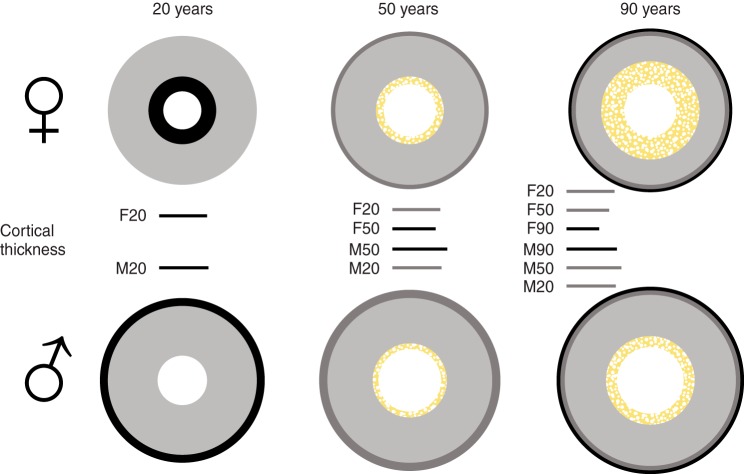
FIGURE 9.
Schematic representation of sex differences around the age of peak bone mass (20 yr) and subsequent lifetime changes at the endosteal and periosteal surface at the tibia [based on the longitudinal QCT findings from Lauretani et al. (294)]. The black interrupted circumferences represent the lower endosteal expansion in women and greater periosteal expansion in men, as compared with the other sex. Changes in cortical thickness are shown as bars in the inset; differences become progressively greater with age. The yellow circles represent the average degree of endosteal bone resorption (and cortical trabecularization) at the tibia in both genders (greater in women). The outer gray circles represent ongoing periosteal expansion in adulthood, which is particularly greater in men between the ages of 20 and 50. The black outer circles indicate ongoing periosteal expansion in old age, which is similar or even slightly greater in women at the tibia (but lower at the radius). [Adapted from Lauretani et al. (294), with permission from John Wiley & Sons, Inc.]

