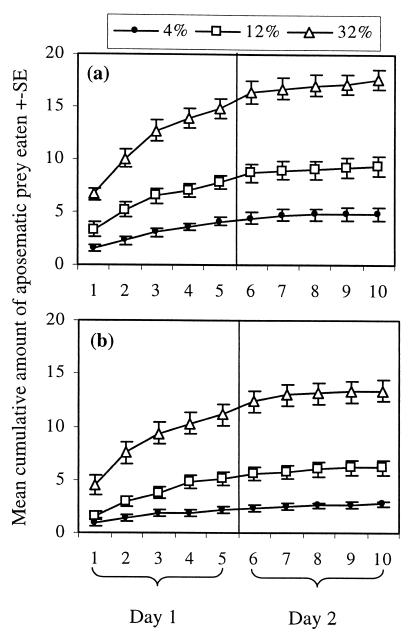
Figure 3.
The mean (± SE) cumulative sum of aposematic prey eaten within the experiment according to the dispersion type, (a) solitary and (b) aggregated. Equal number of prey (altogether 200) was presented on both day 1 and day 2. Birds were allowed to eat 50 prey items each day. Both experimental days are divided into five sections and the numbers of aposematic prey eaten within these sections (10 eaten prey items each) are presented cumulatively. Thus, the 1 refers to the number of aposematic prey eaten within the first 10 consumed prey, 2 within the first 20 etc., and 10 referring to the number of aposematic prey eaten in the whole experiment.

