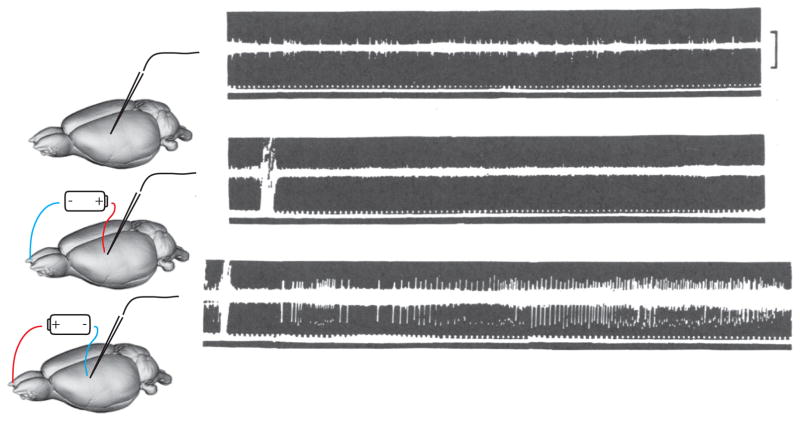
Figure 3.
The raw oscilloscope results from Bindman et al. (1964). The top trace shows the baseline recording from S1 of an anesthetized rat. Each spike is seen as vertical tick mark on the background hash of the multiunit activity. The dots at the bottom of the output show 10 ms tick marks. The voltage bar shows 10 microVolts. The middle trace shows activity at the same location after about 80 ms of cathodal stimulation. The bottom trace shows the activity after 20–30 ms of anodal stimulation.

