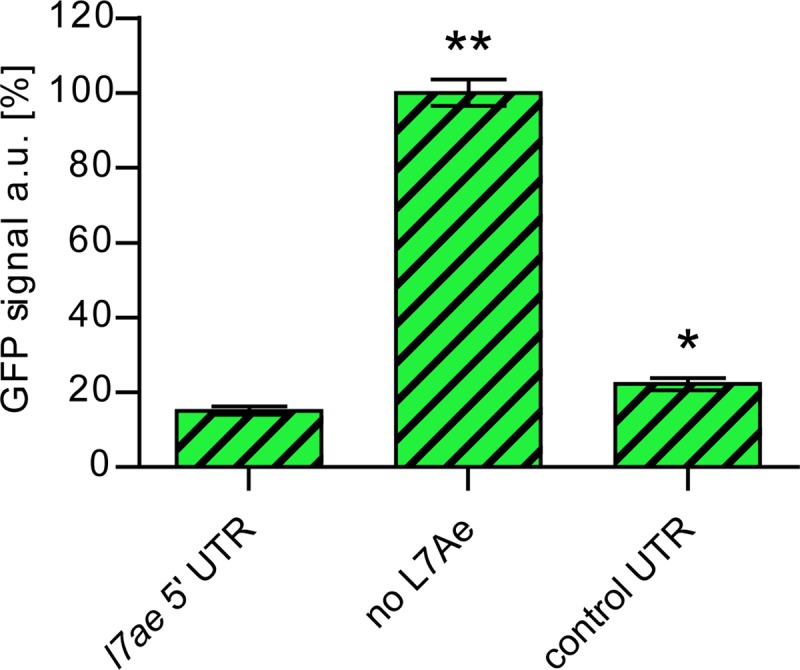
FIG 3 .

Toxicity effects of L7Ae overproduction in E. coli. The relative levels of GFP signals are shown for E. coli cells that were transformed by different variants of a plasmid which contained a constitutively expressed sfgfp gene and the following IPTG-inducible l7ae or region: the l7ae 5′ UTR upstream of the sfgfp gene, the frameshifted l7ae (no L7Ae), or the control UTR upstream of the sfgfp gene. Error bars indicate standard deviations of results from three biological replicates. Asterisks (*, Student’s t test; **, Welch’s t test) indicate the significance (P value = <0.05) of the data with respect to the strain containing the l7ae 5′ UTR. The GFP fluorescence was recorded from the GFP-positive population only.
