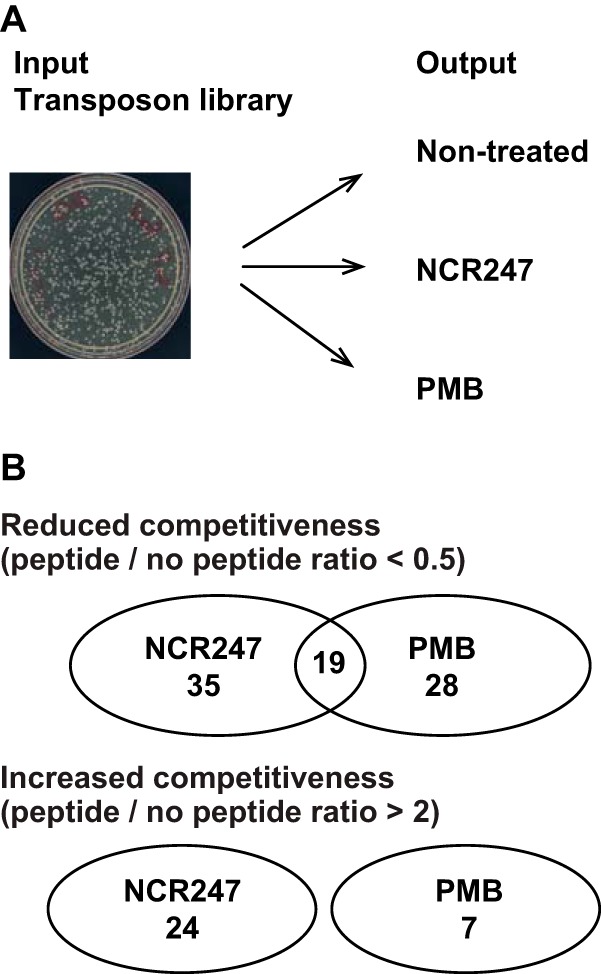
FIG 1 .

Overview of Tn-seq experiments. (A) Schematic overview of the experimental design indicating the input and output samples that were generated for sequencing. (B) Overview of the results obtained. The numbers of genes found to decrease competitiveness and genes found to increase bacterial competitiveness are shown with the indicated cutoff values and the number of genes with overlapping functions that affect NCR247 and PMB competitiveness.
