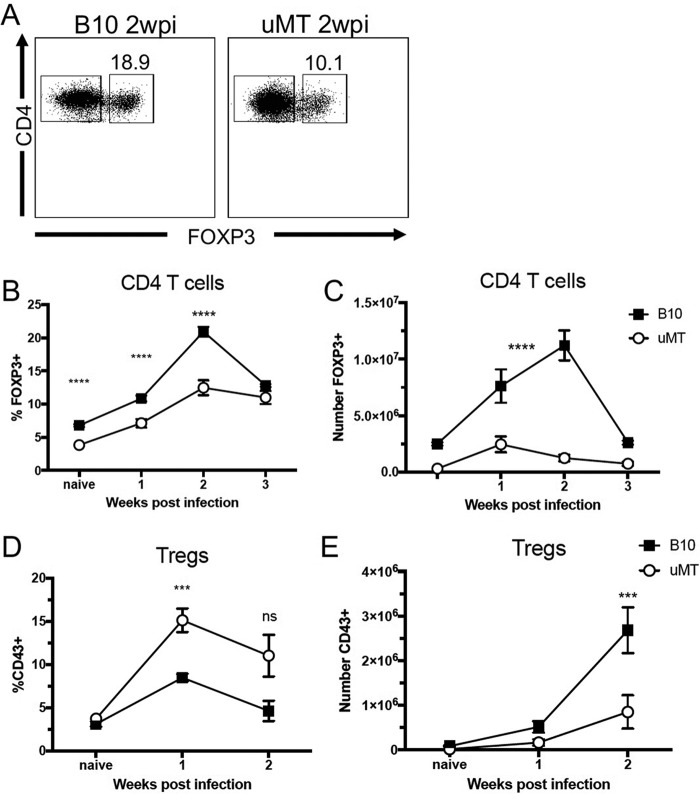
FIG 2 .
Impaired Treg induction during FV infection of B cell-deficient mice. (A to E) C57BL/10 (B10) and μMT mice were infected with 20,000 SFFU of FV i.v. or left naïve, spleens were harvested at 1 week (B to E), 2 weeks (A to E), or 3 weeks (B and C) postinfection, and CD4, FOXP3, and CD43 expression was analyzed by flow cytometry. (A) Representative gating strategy for Tregs (CD4+ FOXP3+) in B10 mice (left) or μMT mice (right) at 2 wpi. (B to E) Quantification of the percentage of Tregs among CD4+ T cells (B), the total number of Tregs (C), the percentage of CD43+ Tregs (D), and the total number of CD43+ Tregs per spleen (E). In panels B to E, each dot represents an average of 5 to 12 mice from pooled experiments and error bars represent ± standard errors of the means (SEM). ***, P < 0.001; ****, P < 0.0001; ns, P > 0.05 (comparing B10 to μMT mice at the indicated time point, as determined by one-way ANOVA with Tukey's posttest for multiple comparisons).

