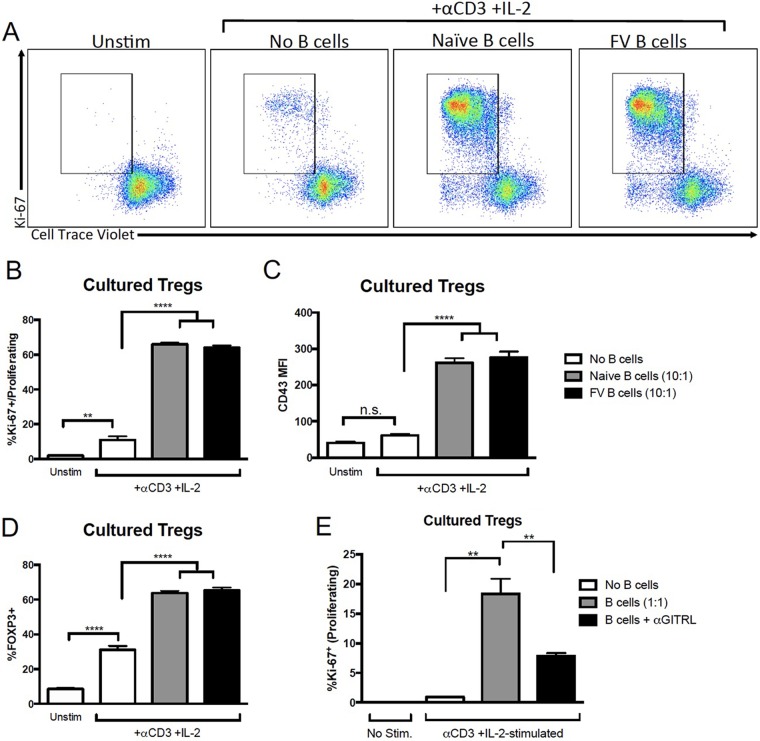
FIG 3 .
B cells induce Treg proliferation and activation in vitro. (A to E) Untreated Tregs were harvested by FACS analysis of GFP+ cells from FOXP3-GFP mice and labeled with CellTrace Violet. B cells were harvested from naive or FV-infected mice at 1 wpi with CD19+ beads and stained with CellTrace Far Red. Tregs were cultured in the absence of B cells or with B cells at a B cell/Treg ratio of either 10:1 (A to D) or 1:1 (E) in the presence of 10 µg/ml anti-CD3 and 10 ng/ml IL-2. As a control, unstimulated (Unstim) Tregs were cultured in the absence of anti-CD3 and IL-2. For panel E, naive B cells were either left untreated or treated with 10 µg/ml anti-GITRL for 1 h prior to coculture. After 2.5 days of coculture, cells were harvested and CD4+ CellTrace Far Red− Tregs were analyzed for FOXP3, Ki-67, CD43, and CellTrace violet expression by flow cytometry. (A) Representative dot plots of Ki-67 and CellTrace Violet expression on Tregs (CD4+ CellTrace Far Red−). The gate shows proliferating cells (Ki-67+ CellTrace Violet−). (B to E) Quantification of proliferation (% Ki-67+ CellTrace Violet−) (B and E), CD43 expression (C), and FOXP3 (D) expression among Tregs (CD4+ CellTrace Far Red−). In panels B to E, bars represent means ± SEM of data from 5 to 12 mice in pooled experiments. **, P > 0.01; ****, P > 0.0001 (as determined by one-way ANOVA with Tukey's posttest for multiple comparisons).

