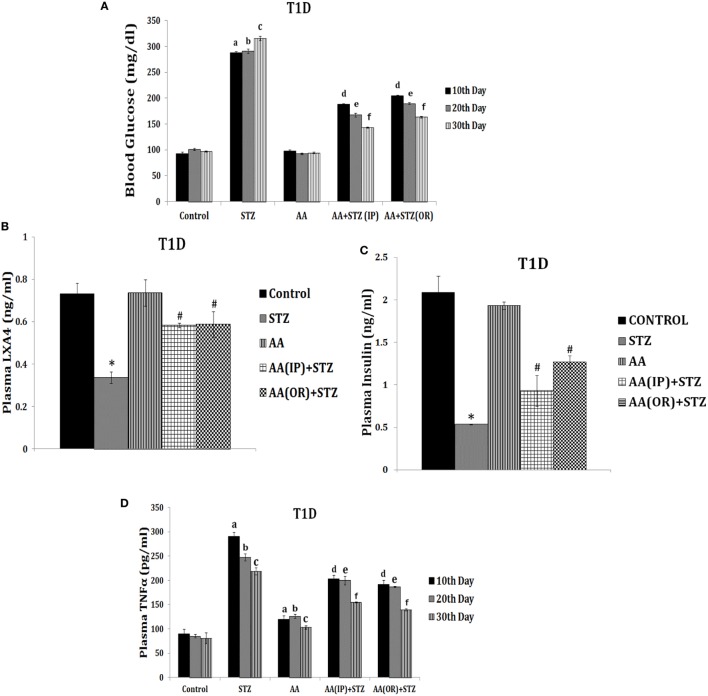
Figure 7.
Effect of arachidonic acid (AA) on streptozotocin (STZ)-induced type 1 diabetes mellitus in Wistar rats [these data are taken from Ref. (137)]. These studies were approved by Institutional Animal Ethics committee. After 7 days of acclimatization, animals received 10 µg/ml of AA intraperitoneally (IP) or oral (OR) for 1 week and once in every week, whereas STZ 45 mg/kg of body weight was given only on day 1. (A) Plasma blood glucose levels in animals: blood glucose estimation was performed once in 10 days until the end of the study. All values are expressed as mean ± SEM. aP ≤ 0.05 compared to 10th day control values. bP ≤ 0.05 compared to 20th day control values. cP ≤ 0.05 compared to 30th day control values. dP ≤ 0.05 compared to plasma glucose levels seen on day 10 after STZ alone administration. eP ≤ 0.05 compared to plasma glucose levels seen day 20 after STZ administration. fP ≤ 0.05 compared to plasma glucose levels seen on day 30 after STZ administration. All the above set of experiments were done in triplicate on two separate occasions (n = 6) and values are expressed as mean ± SEM. *P ≤ 0.05 compared to untreated control. #P ≤ 0.05 compared to STZ. (B) Measurement of lipoxin A4 levels in plasma of AA ± STZ treated animals at the end of the study (day 30). (C) Plasma insulin levels in AA ± STZ treated Wistar rats. Insulin estimation was done in the plasma collected at the end of the study. All values are expressed as mean ± SEM. *P ≤ 0.05 compared to untreated control. #P ≤ 0.05 compared to STZ control (positive control group). (D) Plasma tumor necrosis factor-α (TNF-α) level in AA ± STZ treated rats: TNF-α measurement was done in plasma collected once in every 10 days till the end of the study. All values are expressed as mean ± SEM. aP ≤ 0.05 compared to the 10th day control; bP ≤ 0.05 compared to the 20th day control; cP ≤ 0.05 compared to the 30th day control; dP ≤ 0.05 compared to the 10th day STZ control; eP ≤ 0.05 compared to the 20th day STZ control; fP ≤ 0.05 compared to the 30th day STZ control. *P ≤ 0.05 compared to untreated control; #P ≤ 0.05 compared to STZ control. All values are expressed as mean ± SEM.

