Fig. 1.
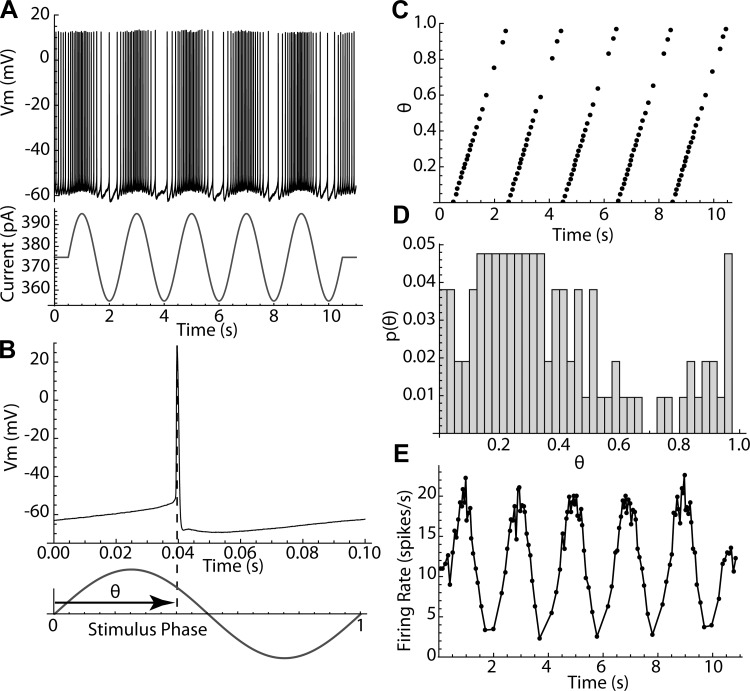
Measurement of the phases of action potentials. A: basics of the experiment; an 11-s trace of a repetitively firing spiny neuron has a 10-s, 20-pA, 0.5-Hz sinusoidal modulation superimposed. Vm, membrane potential. B: each action potential has a phase θ defined relative to the sinusoidal current. Phase varies from 0 to 1. C: graph of the phases of every spike in the trace shown in A. D: histogram of phases for the same trace. E: modulation of instantaneous firing rate for the same trace.

