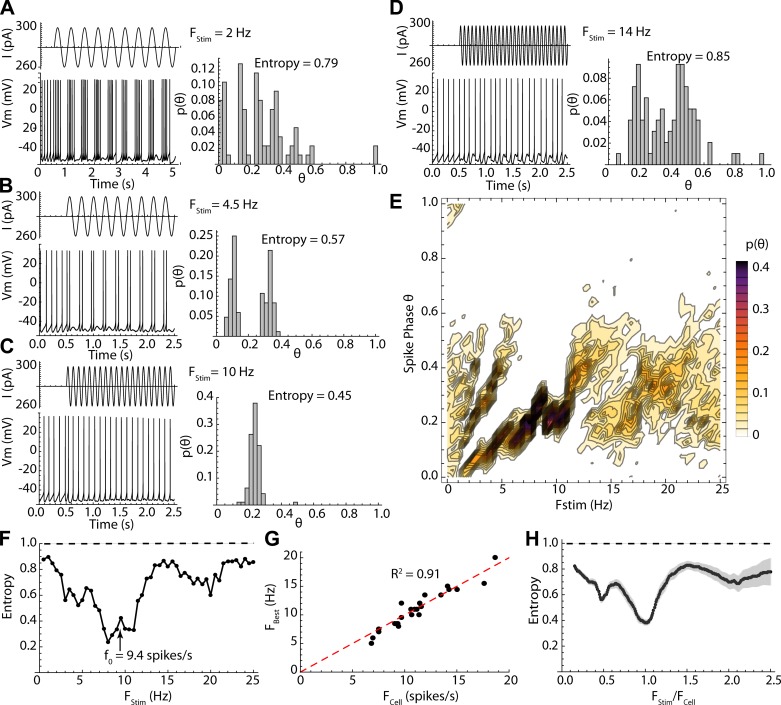
Fig. 2.
Frequency dependence of firing patterns evoked by sinusoidal current. A–D: stimulus currents (traces at top left), neuronal responses (traces at bottom left), and spike phase distributions and their entropies (right) for selected stimulus frequencies in an example cell. E: combined spike phase distribution for all stimulus frequencies tested in the same cell. Each histogram is a column, and probability is in color. Note firing twice per cycle between 3 and 6 Hz and once per cycle from 7 to 11 Hz. In both cases the phase of entrainment increases with increasing stimulus frequency. F: entropy of the phase distribution for all frequencies tested in the same example cell, which had an unperturbed firing rate (f0) of 9.4 spikes/s (arrow). The phase-locked frequency range was centered on the cell’s unperturbed rate. The entropy values expected if the stimulus intensity were zero are shown by the dashed line. G: relationship between frequency of best phase locking (lowest entropy) vs. unperturbed firing rate for the sample of 24 neurons. H: entropy vs. stimulus frequency (like that shown in F) but for the sample (standard error of estimates in gray). Frequency is normalized by each cell’s unperturbed firing rate to allow comparison across cells firing at different rates. Sine wave stimulation modulates firing pattern at all frequencies but is most effective at the cell’s unperturbed firing rate.

