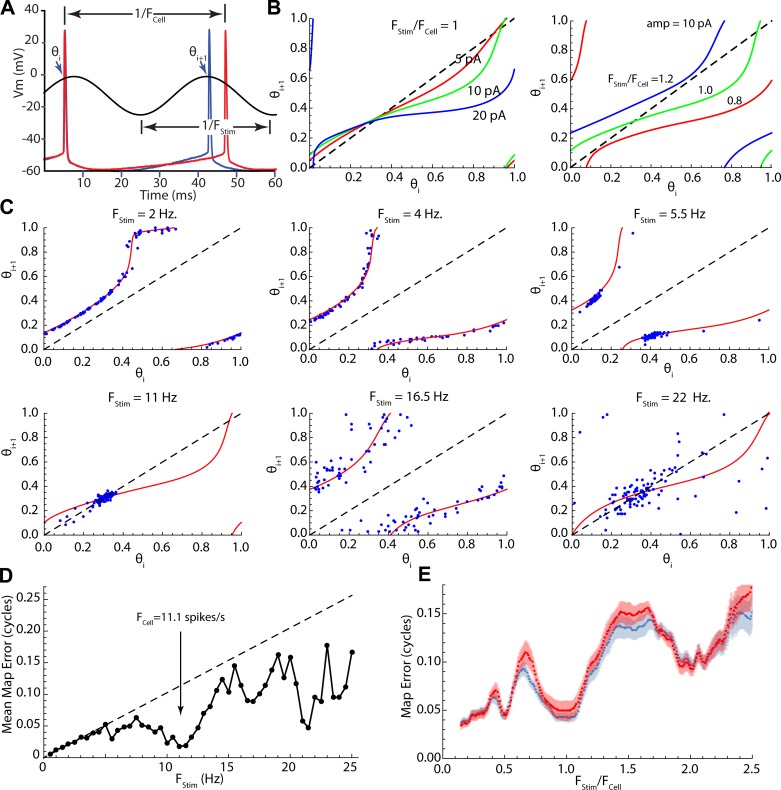
Fig. 5.
Iterative maps of spike phase on sine wave stimuli. A: measurement of phase pairs. The phases of the ith and (i+1)th action potentials on the stimulus (blue trace) and the trajectory of an unperturbed interspike interval (red trace). B: stimulus frequency and amplitude (amp) dependence of the phase map. Increasing stimulus intensity increases the deviation of the map from the diagonal, whereas changes in stimulus frequency translate the map. C: comparing the maps, based on the phase model, with actual stimulus phases of spike pairs in an example spiny neuron. D: phase map error for the example shown in C. Dashed line indicates expected error for a zero-amplitude stimulus. Note especially accurate predictions for the map near the cell’s unperturbed firing rate (arrow) and at twice that frequency. E: averages ± SE of map prediction errors for the entire sample. Prediction errors were calculated twice, once (blue curve) using each cell’s individual PRC and once (red curve) using the average PRC for striatal spiny neurons. Stimulus frequency is normalized to each cell’s unperturbed firing rate to allow comparison across neurons.

