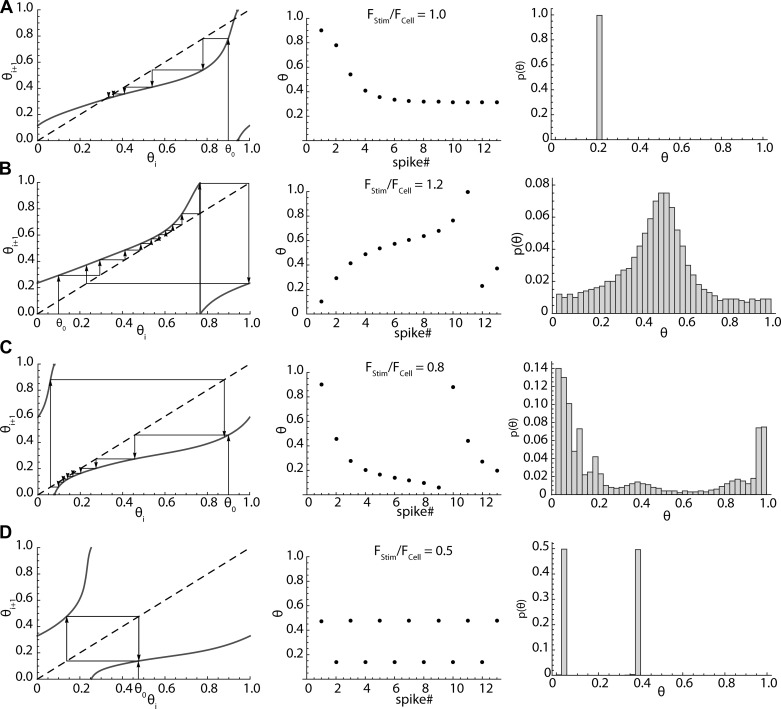
Fig. 6.
Predicting phase sequences and histograms by map iteration. The order of phases in the sequence is indicated by arrows. A: fixed points in the map (left) arise when the map (solid line) crosses the identity line (dashed line). One of the crossings will be stable, and phase sequences (middle) approach that point. This is phase lock. The steady-state phase distribution (right) consists of only that point, the phase at lock. B: at sufficiently high stimulus frequency there is no longer a fixed point, but a sequence of stimulus phases. Phases associated with the closest approach of the map to the identity line occur more than others, because the stimulus causes the cell to speed up at these phases, reducing the difference between the stimulus frequency and the firing rate. C: at stimulus frequencies too slow to have a fixed point in the map, the closest approach of the map to the identity line occurs at earlier phases, at which the stimulus is most effective at slowing the cell’s firing. The cell fires faster at other parts of the sequence. D: when the stimulus frequency is half the cell’s firing rate, the cell fires twice on each stimulus cycle. Each of the two stimulus phases at which the cell fires maps onto the other.

