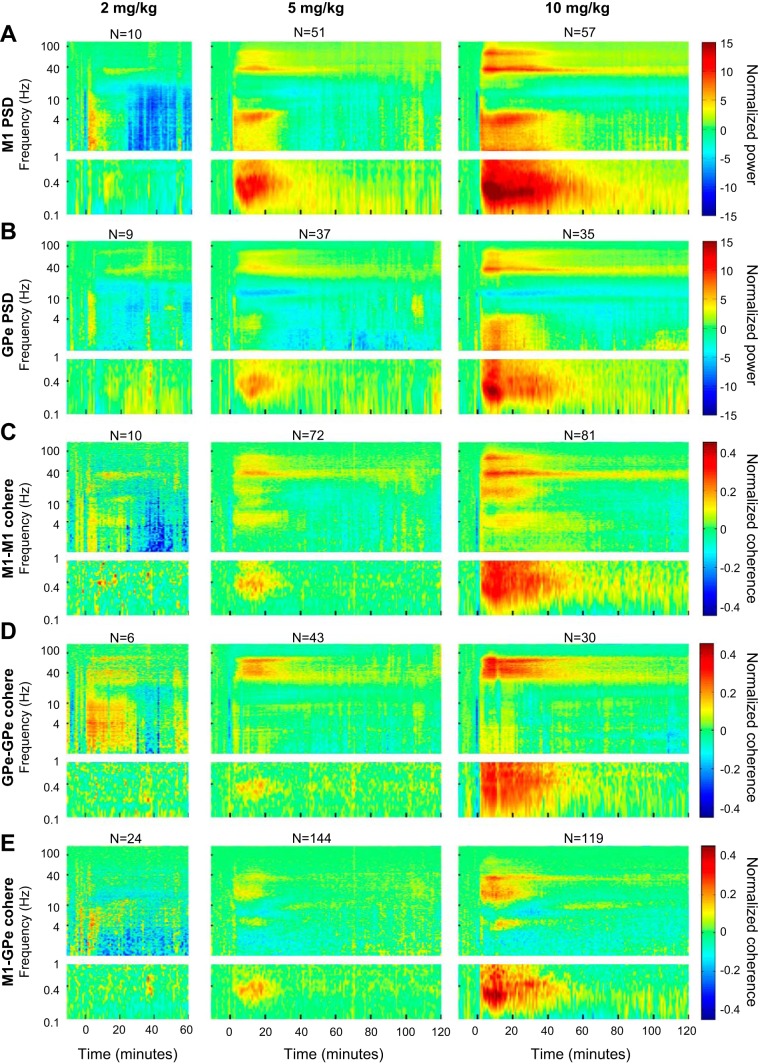
Fig. 10.
Ketamine induces spectral and coherence changes in a dose-dependent manner. A and B: the normalized average autospectrogram of all cortical (A) and pallidal (B) LFPs according to the different doses of ketamine. C–E: the normalized average coherence between all pairs of cortical (C), pallidal (D), and cortical-pallidal (E) LFPs according to the different doses of ketamine. In A–E, left recordings follow administration of 2 mg/kg ketamine from monkey Sa only; middle recordings follow administration of 5 mg/kg ketamine from monkeys Sa and M; and right recordings follow administration of 10 mg/kg ketamine from monkey Sa and M. N represents the total (maximal) number of LFPs (PSD subplots) or LFP pairs (coherence subplots) recorded for each condition. In the 2 mg/kg dose, the number of LFPs remained constant in all time bins. In the 5 and 10 mg/kg doses, the number of LFPs or LFP pairs decreased throughout the recording; the average number (across all time bins) was 45, 34, 63, 40, and 130 in the 5 mg/kg dose (A–E, respectively) and 57, 35, 80, 30, and 118 in the 10 mg/kg dose (A–E, respectively). M1, primary motor cortex; GPe, external globus pallidus; cohere, coherence; PSD, power spectral density.

