
Fig. 3.
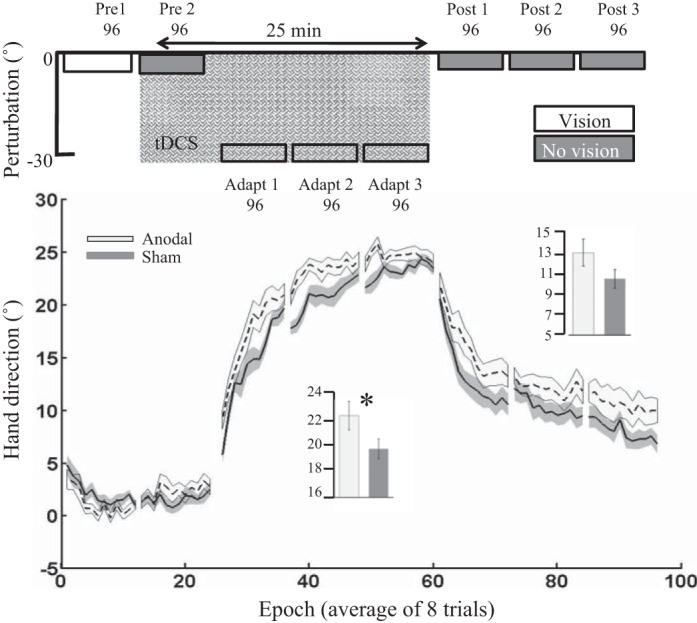
Experiment 1: vertical screen. Epoch (average across 8 trials) uncorrected angular hand direction (°) data are shown for the anodal and sham ctDCS groups. Positive values indicate CW hand direction. Bar graph insets indicate mean hand direction for the anodal and sham groups during adaptation (adapt 1–3) and retention (post 1–3). This was determined for each participant by averaging consecutive epochs (see materials and methods). Independent t-tests were used to compare values between groups. Solid lines indicate the mean; shaded areas and error bars indicate SE. There was a significant difference between the anodal and sham ctDCS groups (14 in each group) during adaptation [t(26) = 2.9, *P = 0.007, d = 1.17].