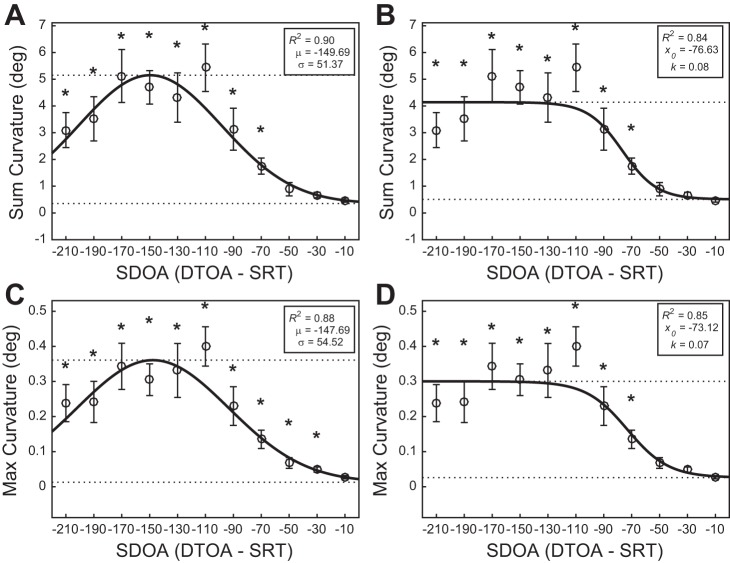
Fig. 2.
Gaussian and logistic models fitted to the overall mean sum and max curvatures as a function of SDOA bin center. Data points (open circles) represent mean saccade curvature. Error bars represent SE. Broken lines depict fitted floor and ceiling parameters. Asterisks denote significant (P < 0.05) curvature deviations from baseline. A: Gaussian model fitted to the overall sum curvature data. B: logistic model fitted to the overall sum curvature data. C: Gaussian model fitted to the overall max curvature data. D: logistic model fitted to the overall max curvature data.

