Fig. 4.
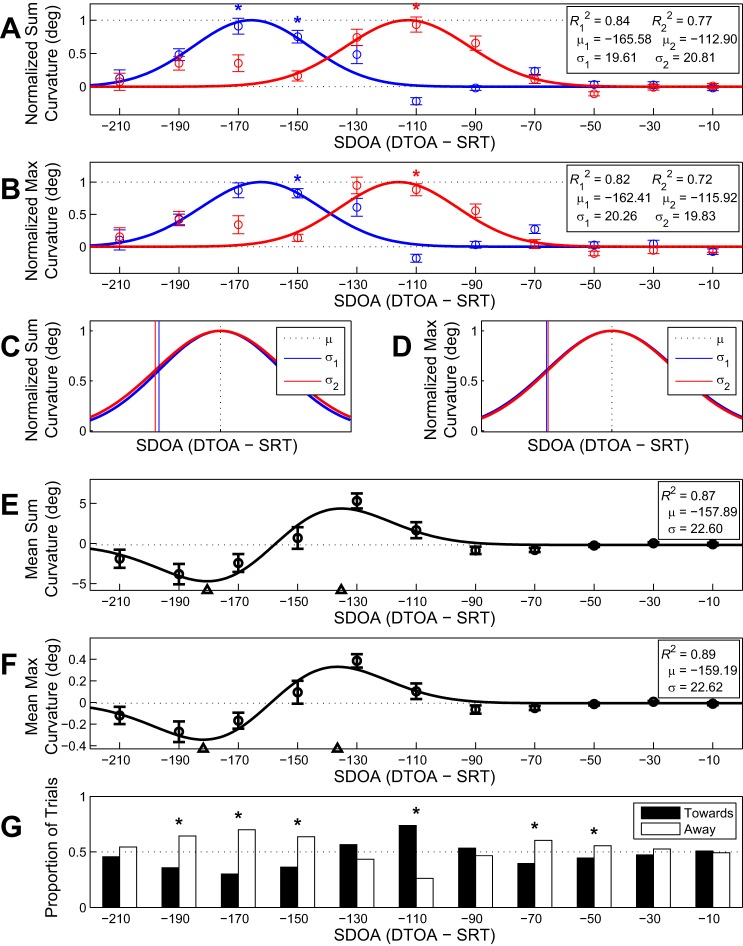
Accumulation models for excitation and inhibition. A and B: normalized Gaussian models fitted to the absolute sum (A) and max (B) curvatures as a function of SDOA bin split into trials with a saccade curved away from the distractor (blue) and toward the distractor (red). Data points (open circles) represent absolute mean saccade curvature. Error bars represent SE. Broken lines depict fitted floor and ceiling parameters. Asterisks denote significant (P < 0.05) curvature deviations from baseline. C and D: from A and B, the normalized Gaussian models for absolute mean sum (C) and max (D) curvature as a function of SDOA adjusted so that the fitted functions for trials with saccades curved away (blue) and toward (red) distractors are overlapped. The broken vertical black line represents the overlapped midpoints (μ = μ1 = μ2), and the solid vertical blue and red lines depict μ − σ for away and toward trials, respectively. E and F: fitted first-order Gaussian derivative models for signed mean sum (E) and max (F) curvature as a function of SDOA. Broken line depicts the vertical midpoint of the function, and open triangles on the abscissa represent μ ± σ, which correspond to the function maxima and minima and depict the time point of peak excitation and inhibition, on average. G: proportion of trials with a saccade curved toward (filled bars) or away from (open bars) a distractor in each SDOA bin. Asterisks denote significant (P < 0.05) deviations from a random distribution of trials with saccades curved toward or away from distractors.

