Fig. 1.
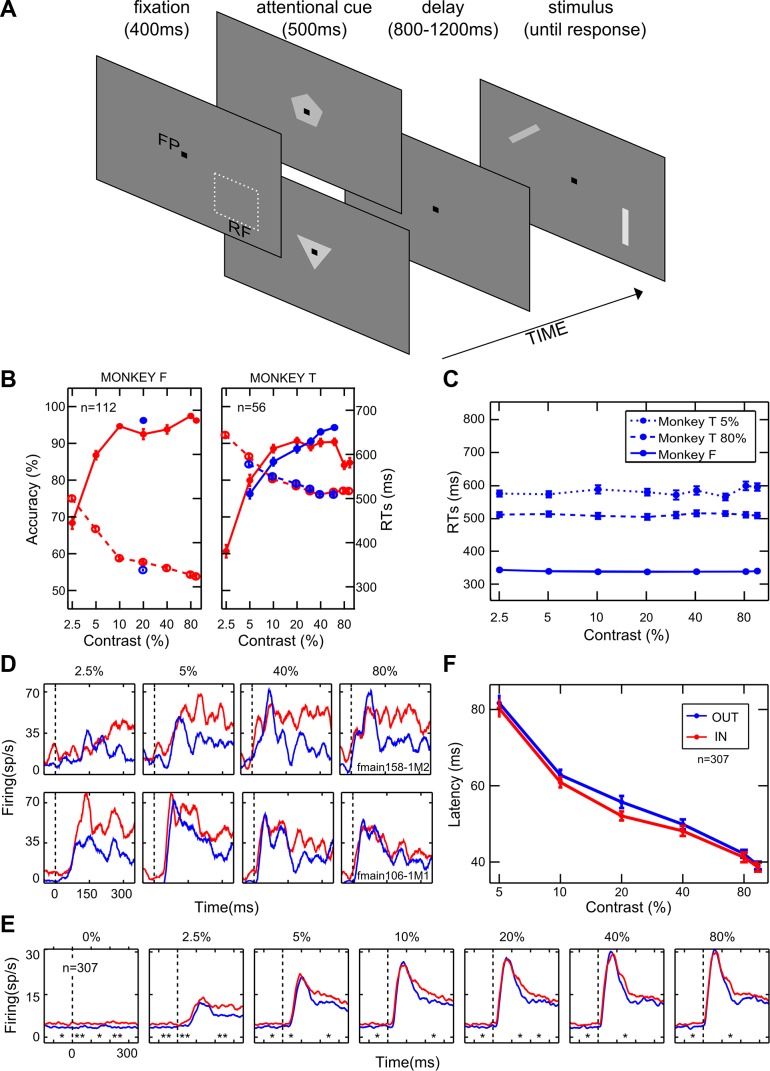
General effects of attention. A: temporal sequence of events in the behavioral task. FP, fixation point; RF, classical receptive field. The pentagon and the triangle represent the cue stimuli instructing attention outside or inside the RF, respectively; bars represent the stimuli to be discriminated. B: each panel represents the behavioral performance of 1 monkey. Average accuracy (percentage of correct responses) and reaction times (RTs) as a function of %contrast are represented along the left and the right axes, respectively. Solid and dashed lines depict accuracy and RTs, respectively, for the orientation discrimination task performed inside (red) or outside (blue) the RF of the neuron under study; n, no. of averaged sessions. Only 1 data point is shown for monkey F in the attention-outside condition because the contrast was set to be constant (20%; see materials and methods). C: average RTs measured for the orientation task performed outside the RF as a function of the distracter contrast (i.e., the contrast of the stimulus inside the RF, as shown on the x-axis). For monkey F, performance is shown for the task executed on the intermediate contrast (20%; solid blue line; see materials and methods). For monkey T, instead, performance is shown for the task executed on a low contrast (5%; dotted blue line) or a high contrast (80%; dashed blue line). D: PSTHs are plotted for 4 representative levels of contrast and aligned with stimulus onset for a monotonically saturating (top panels) and a contrast-selective (bottom panels) single-cell example. Blue and red lines represent neuronal responses in the unattended and attended conditions, respectively. E: population PSTHs are shown for 6 logarithmically spaced levels of contrast for the whole population of cells; conventions are as in D. *P < 0.05; **P < 0.01, significant differences in firing between the attended and unattended conditions in 100-ms consecutive windows (Wilcoxon Mann-Whitney test). F: population averaged latency (in ms) is plotted as a function of %contrast when attention was allocated outside (blue) or inside (red) the RF. Each point represents the average (mean ± SE) across neurons.

