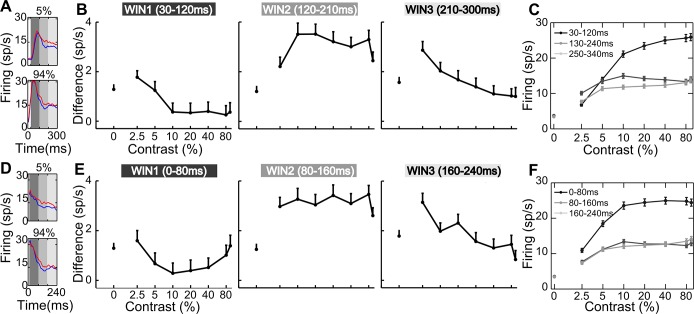
Fig. 5.
Early, intermediate, and late epochs. A and D: population PSTHs time-locked to stimulus onset (A) and to visual response onset (D) are plotted for 5% and maximal contrast in both the attended (red) and unattended (blue) conditions. The gray shaded areas represent critical time windows: early (30–120 ms), intermediate (120–210 ms), and late (210–300 ms). B and E: average response difference (sp/s, spikes/s) is plotted as a function of contrast for the early (left), middle (middle), and late windows (right), using stimulus-locked (B) and visual response-locked (E) spike trains. Vertical lines represent SE. C and F: population CRFs in the unattended condition are shown for each temporal window aligned to stimulus onset (C) and visual response onset (F).

