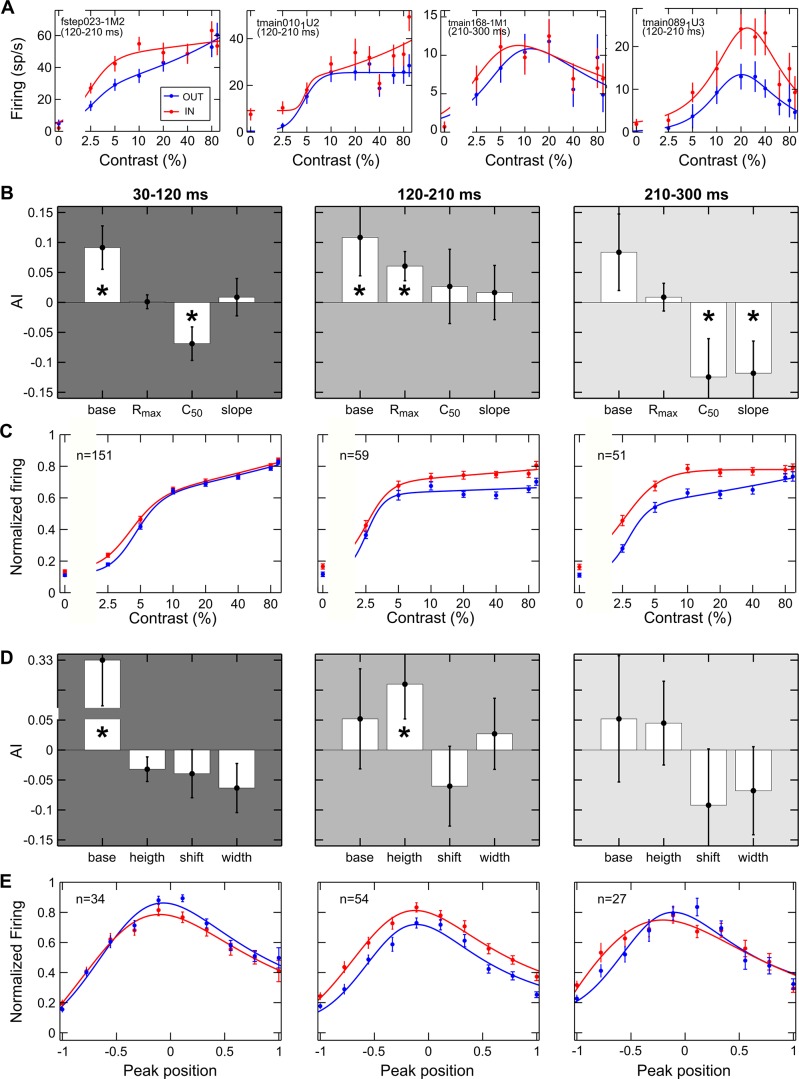
Fig. 6.
Effects of attention on different cell classes. A: a contrast gain (1st panel) and a multiplicative modulation (2nd panel) are reported for 2 example cells showing traditional monotonic CRFs. A contrast gain (3rd panel) and a multiplicative modulation (4th panel) are reported for 2 example cells showing selective CRFs. Mean firing rate (spikes/s) is plotted as a function of %contrast for the attended (red) and unattended (blue) conditions. Each point represents the average of ≥12 stimulus presentations, along with its SE (vertical lines). Solid lines depict the best fitted curve provided by the Peirce equation. Labels report the cell name and the temporal window used to calculate firing. B: attentional modulation of the average best fitted parameters of traditional monotonic cells. AI was calculated for parameters provided by the Peirce function for each neuron in both attentional conditions and then averaged across cells for the early (left), intermediate (middle), and late window (right). Vertical lines represent SE. *P < 0.05 indicates the mean of the AI distribution was significantly different from zero (Wilcoxon test). C: average normalized responses of cells showing a traditional CRF in both the attended (red) and unattended (blue) conditions are reported as a function of contrast for each time window. Vertical lines represent SE. Solid lines represent the best fitted curve provided by the Peirce function. D: attentional modulation of the average best fitted parameters of contrast selective cells; same conventions as in B. E: average normalized responses of cells showing contrast-selective responses in both attentional conditions are plotted after the CRFs of all units were aligned to their respective peak position in the unattended condition (see materials and methods); same conventions as in C.

