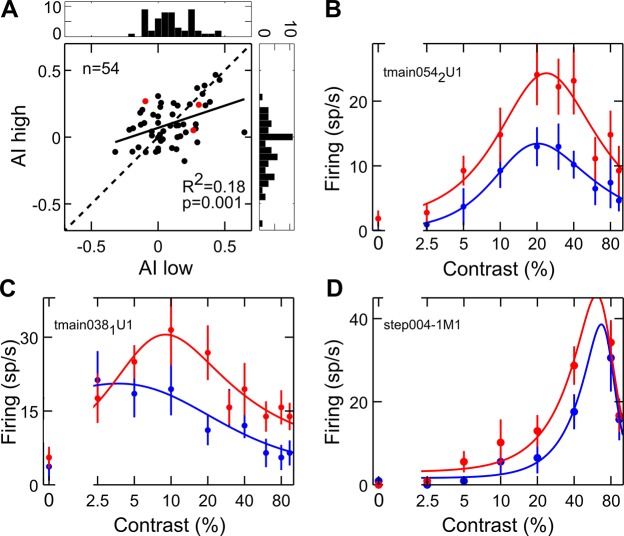
Fig. 7.
Modulation of contrast-selective cells during the multiplicative stage. A: scatter plot comparing the single-cell attention index (AI) separately for responses to contrasts lower (AI low) and higher (AI high) than the preferred one, as established in the unattended condition. Histograms represent the distribution of AI for the contrast higher (right plot) and lower (top plot) than the preferred one. Red dots represent the position in the scatter plane of the 3 single-cell examples shown in B–D. B–D: attentional modulation of contrast-selective cells (same conventions as in Fig. 6A). Data in B represent an example neuron lying on the diagonal and thus showing symmetric attentional effects of attention on the 2 flanks of the tuning function, i.e., a pure multiplicative effect. Data in C represent an example neuron lying on the left of the diagonal (top left quadrant), thus showing a stronger effect of attention on the right flank of the tuning function (i.e., for contrasts higher than the peak). Data in D represent a contrast-selective neuron lying on the right of the diagonal (top right quadrant), thus showing a stronger attentional effect for contrasts lower than the peak. In all cases, the largest effect in this temporal window (intermediate epoch) mainly occurs for the contrast level eliciting the maximal response, thus confirming a multiplicative rescaling of neuronal responses. Interestingly, in the examples shown in C and D, the asymmetry in the attentional modulation along the flanks of the tuning curve appears to be related to peak position in the given neuron, as confirmed by quantitative analyses (see text).

