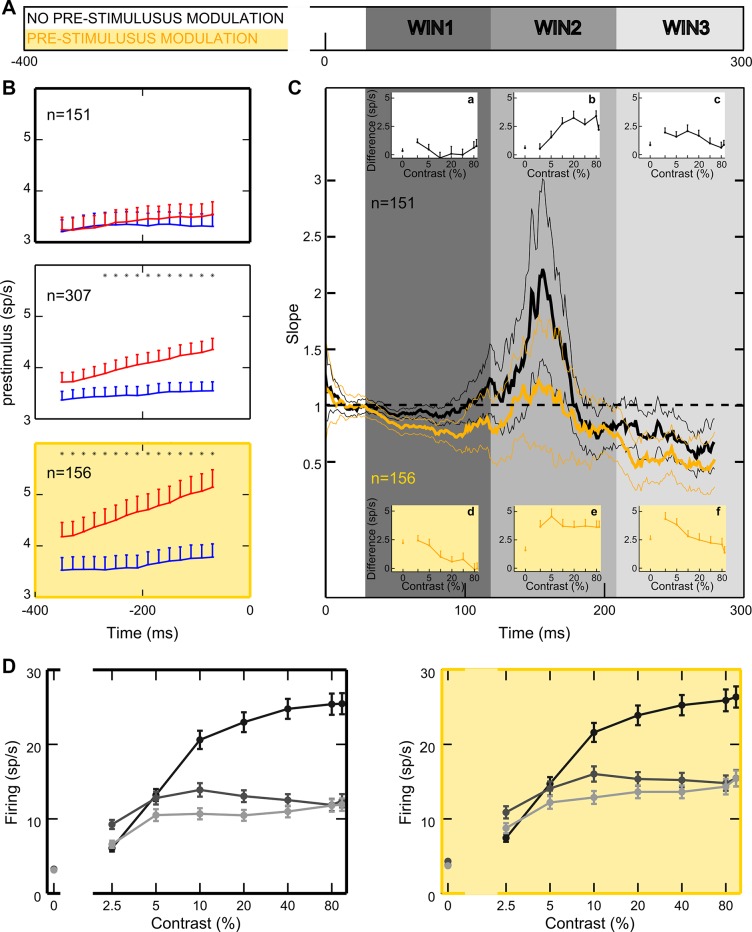
Fig. 10.
Poststimulus modulation of attention interacts with prestimulus modulation. A: the bar illustrates the timeline and critical analysis windows: yellow and white bands show the time window used to analyze prestimulus modulation; gray bands show the early, intermediate, and late windows. B: time course of prestimulus modulation. Attentional modulation is calculated before stimulus onset in 100-ms windows, shifted by 25 ms, for the whole population (middle), for the population with (bottom) and without (top) a reliable baseline shift. C: time course of the attentional effects for the subpopulations of cells with (yellow) and without (black) a reliable baseline shift. Model slope values are shown as a function of time; thin lines delimitate 95% confidence intervals computed using a subsampling procedure (with the size of each subsample corresponding to 100 cells; see materials and methods). Insets show the spike difference between the attended and unattended condition in each window of interest, separately for the population of cells unmodulated (insets a–c, white background) and modulated by attention before stimulus onset (insets d–f, yellow background). D: unattended population CRFs for each temporal window locked to the stimulus onset are reported for the subpopulation of cells with (right) and without baseline shift (left).

