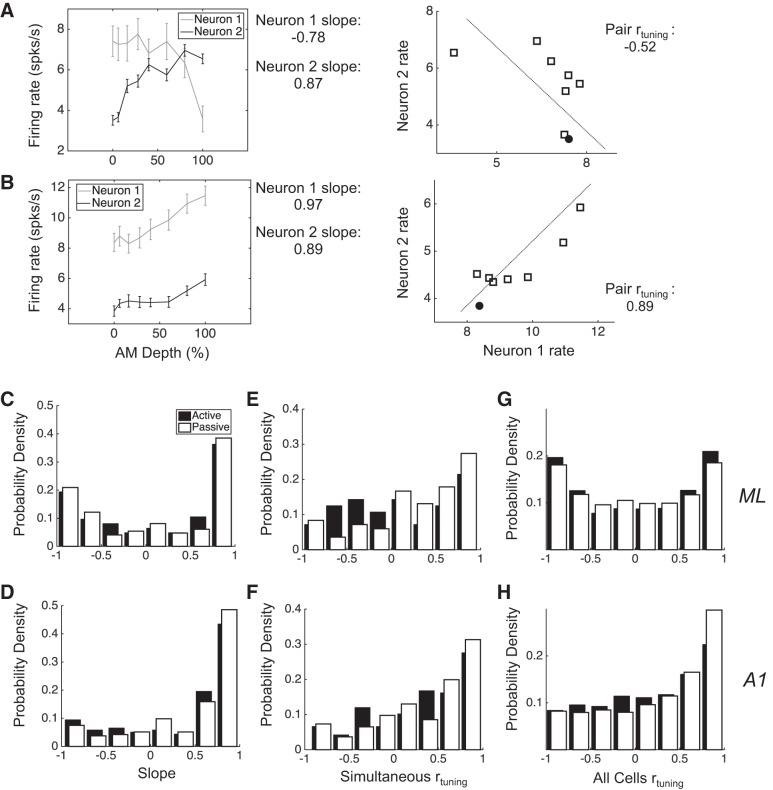
Fig. 1.
Different AM tuning properties in A1 and ML lead to different rtuning distributions. A, left: shown are the firing rates along the range of tested AM depths for 2 simultaneously recorded ML neurons, with their rate-depth slopes noted at right. Right panel shows their joint mean firing rate distribution and the rtuning value between them. This value is negative because as the mean firing rate of neuron 1 decreases, the mean firing rate of neuron 2 increases. B: same as in A but for a pair with positive rtuning. C and D: the distribution of slopes in ML has 2 peaks, corresponding to distinct populations of neurons with increasing and decreasing rate-depth slopes, respectively, whereas the distribution in A1 has 1 peak and favors increasing slopes. E and F: the rtuning of simultaneously recorded pairs in ML and A1 (simultaneous rtuning) reveals a greater proportion of pairs with negative rtuning in ML. G and H: rtuning is calculated between all recorded neurons (all cells rtuning), showing that the rtuning distribution has 2 peaks in ML and 1 positive peak in A1. Error bars are SE.

