Fig. 9.
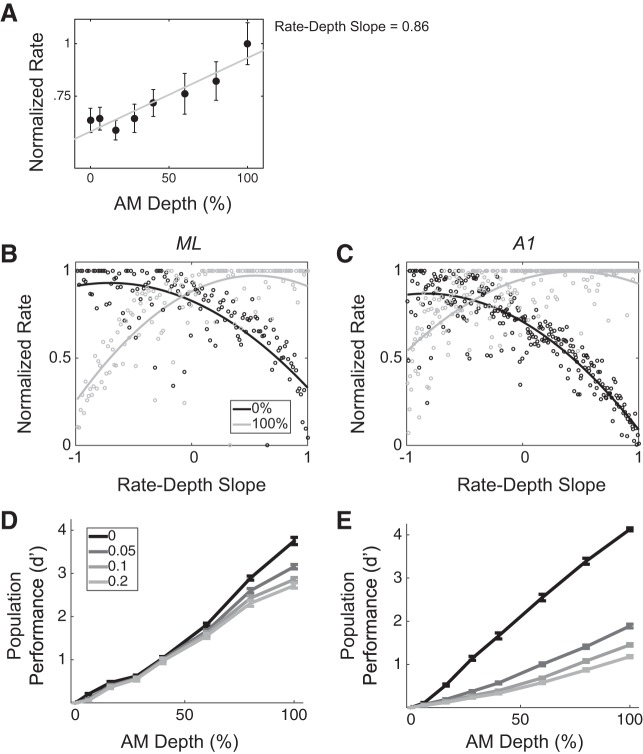
ML and A1 modeled populations are differentially affected by rnoise. A: an example neuron’s normalized firing rate and slope. B and C: 2 example instantiations of modeled populations of size n = 100 neurons. Populations are modeled as arrays of tuned filters, with neurons arranged according to AM slope (from most negative to most positive). Population mean responses to each stimulus are fit with 3rd-order polynomial least-squares curves (solid lines). Each data point represent the mean (maximum normalized) response of one neuron to one stimulus (black for 0% AM and gray for 100% AM). D and E: in populations of n = 100 neurons, across 400 simulated trials per simulated rnoise, average classifier performance was obtained at each AM depth in ML and A1. Whereas ML is modestly affected by rnoise, and only at higher AM depths, A1 performance is dramatically reduced for weakly positive rnoise values at each depth other than 6%.

