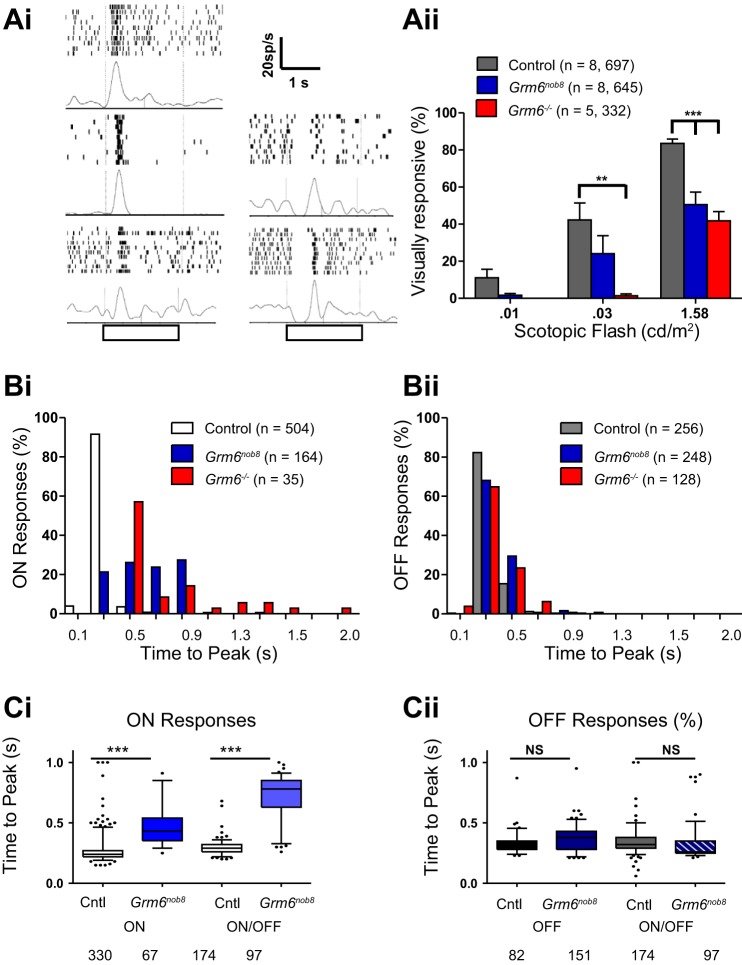
Fig. 6.
Grm6nob8 RGC visual responses reflect a mixture of normal and abnormal ON pathway inputs. Ai: representative PSTHs show responses to light onset for RGCs from the 3 different genotypes with short onset latencies (left) and those in the mutants with slow onset latencies (right). Open bar below x-axis indicates timing of the light flash. Color convention is the same as in Aii. Aii: mean (± SE) % of visually responsive RGCs (those with spontaneous as well as stimulus-evoked spiking) are compared across Grm6nob8, Grm6−/−, and controls across 3 dim flashes under scotopic conditions (n = retinas, cells recorded). B: frequency histograms compare the time to peak of the firing rate of ON (Bi) and OFF (Bii) responses in control, Grm6nob8, and Grm6−/− RGCs. ON responses of both Grm6nob8 and Grm6−/− RGCs are delayed compared with control RGCs (Kruskal-Wallis, P < 0.001; n = cells recorded). Differences in distribution were not observed for OFF responses. C: time to peak for ON (Ci) and OFF (Cii) responses from ON, ON/OFF, and OFF RGCs from control and Grm6nob8. Bars indicate mean, and whiskers represent 5th and 95th percentiles. Individual points indicate measures that fall outside of the 5th to 95th percentile range. These data show that the only difference between genotypes is in the ON responses of both ON and ON/OFF RGCs. In Grm6nob8 mice there are many more RGCs whose ON responses had time to peak within the control range (≤0.7 s) compared with Grm6−/−. Of RGCs with ON responses (which includes both ON and ON/OFF cells), 86 of 164 (52%) were within the control range for Grm6nob8 (n = 8 retinas) while 11 of 35 (31%) were within the control range for Grm6−/− (n = 5 retinas). Differences were not observed in OFF response times to peak across genotypes (Cii). In Bi and Bii, the histograms are binned (0.4 s), as indicated on x-axis. In Ci and Cii, numbers indicate number of cells. **P < 0.01, *** 0.001. NS, P > 0.05.

