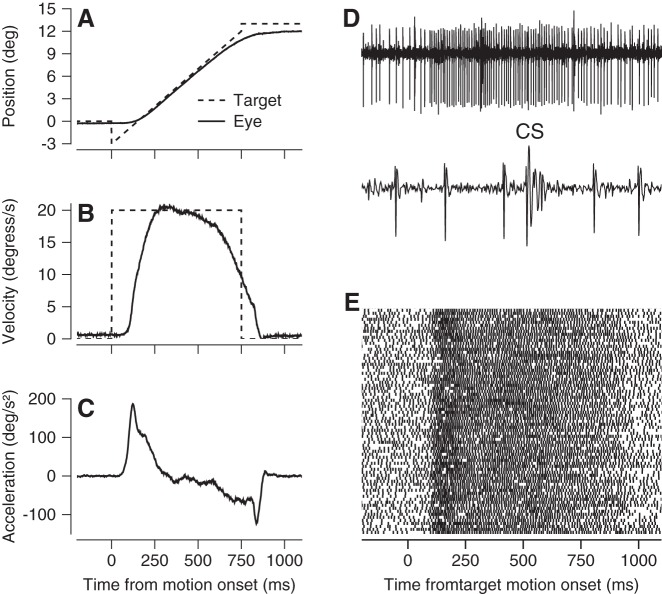
Fig. 1.
Example recording from a Purkinje cell in the oculomotor vermis during pursuit eye movements. A–C: averages of eye and target position, velocity, and acceleration vs. time for step-ramp target motion. Dashed and solid lines show target and eye kinematics, respectively. D: extracellular potentials from a Purkinje cell on slow and fast time base, showing both simple spikes and 1 complex spike (labeled CS). E: raster showing simple-spike times during 100 repetitions of the same target motion and pursuit eye movement. Each line shows data from 1 trial, and each dot indicates the time of occurrence of 1 action potential.

