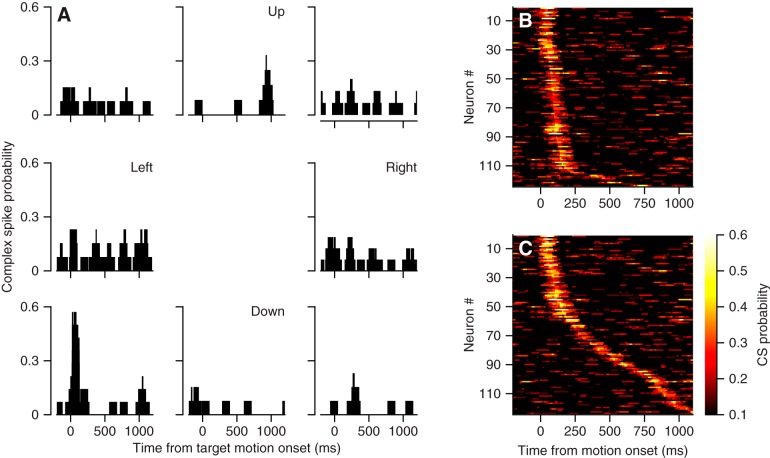
Fig. 5.
Complex-spike responses of Purkinje cells in the oculomotor vermis during pursuit eye movements. A: direction tuning for an example Purkinje cell. Each graph is positioned to indicate the direction of target motion and the histograms show the probability of a complex spike as a function of time in a sliding 100-ms bin. B and C: summary of probability of complex spikes during pursuit in the preferred direction, where preferred direction is defined in B by the largest response in the interval from 50 to 250 ms after the onset of target motion and in C by the largest response across the entire trial. Here, the colors indicate the probability of a complex spike in a 100-ms sliding bin, each horizontal line shows data for 1 Purkinje cell, and time goes from left to right.

