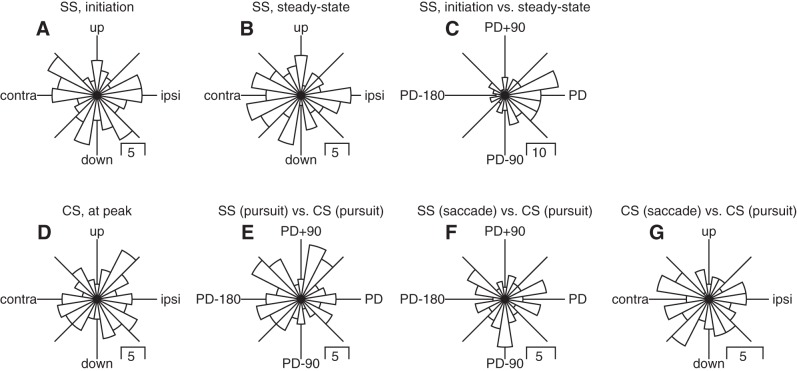
Fig. 6.
Direction tuning of simple spikes (SS) and complex spikes for the population of Purkinje cells in the oculomotor vermis during saccades and pursuit. A–G contain a polar histogram showing the distribution of a particular measure of preferred direction across the full sample of Purkinje cells. A: simple-spike firing from 150 to 250 ms after the onset of target motion. B: simple-spike firing from 500 to 600 ms after the onset of target motion. C: difference for simple-spike firing between 150 and 250 and 500–600 ms after the onset of target motion. D: peak complex-spike probability in the interval from 50 to 250 ms after the onset of target motion. E: difference between preferred simple-spike and complex-spike direction, both in the interval from 50 to 250 ms after the onset of target motion. F: difference between preferred simple-spike direction during saccades and preferred complex-spike direction during pursuit initiation. G: difference between preferred complex-spike directions during saccades and pursuit.

