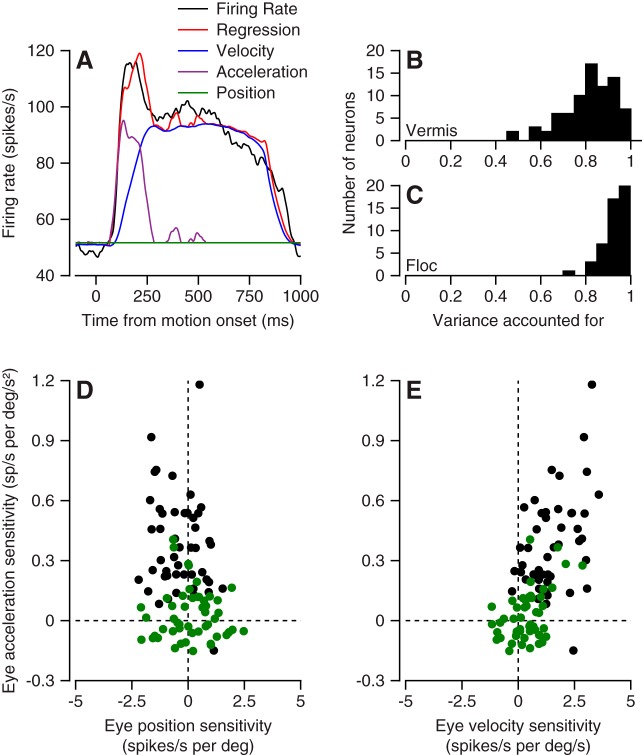
Fig. 7.
Comparison of relationship between simple-spike firing and eye kinematics during pursuit for oculomotor vermis and floccular complex. A: firing rate vs. time showing the contribution of different kinematic components, according to the colors in the key. B and C: variance accounted for by Eq. 2 for Purkinje cells in oculomotor vermis (B) and floccular complex (C). D and E: scatterplots summarizing sensitivity to eye position, velocity, and acceleration for our full sample of Purkinje cells. Green and black symbols show data for oculomotor vermis and floccular complex.

